Multiple Time Graphical Analysis (MTGA)
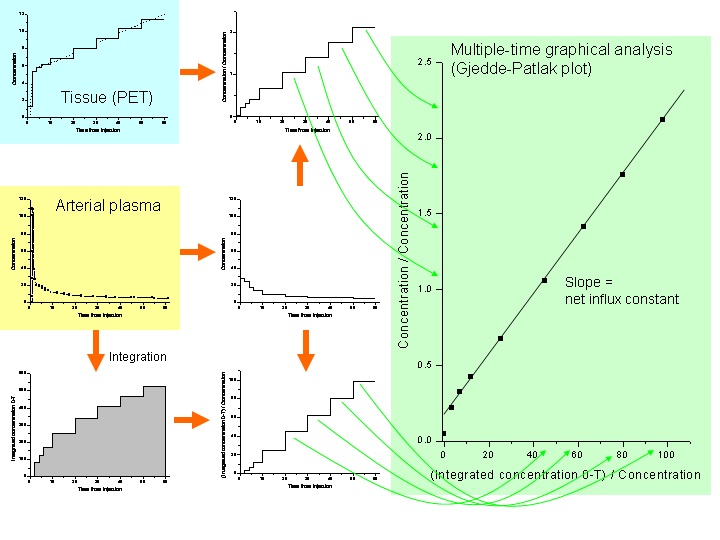
In multiple-time graphical analysis the radiopharmaceutical concentration curves of tissue region-of-interest and arterial plasma are transformed and combined into a single curve that approaches linearity when certain conditions are reached. The data could be plotted in a graph, and line can be fitted to the linear phase. The slope of the fitted line represents the net uptake rate of the radiopharmaceutical or volume of distribution. In some instances a reference region curve can be used as input function in place of arterial plasma input.
The graphical analysis methods are independent of any particular model structure, although the slope can be interpreted in terms of a combination of model parameters for some model structure. Graphical analysis methods have been developed for reversibly and irreversibly binding radiopharmaceuticals (Logan, 2000 and 2003).
Munk (2012) proposed using vi-plot to study at which time point the quasi steady state is reached, allowing the linear fitting of Logan or Patlak plots.
MTGA for irreversible uptake (Patlak plot)
Principles of Patlak analysis
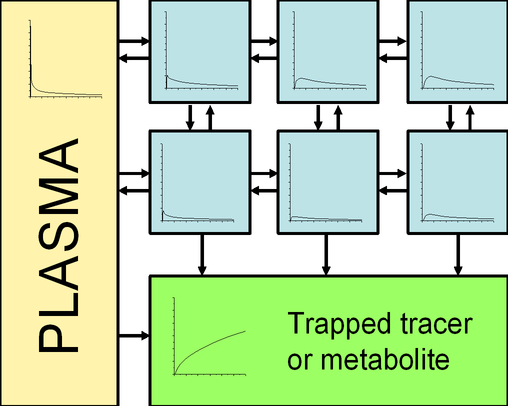
The original idea of Patlak and Blasberg was to create a model independent graphical analysis method: whatever the radiopharmaceutical is facing in the tissue, there must be at least one irreversible reaction or transport step, where the radiotracer or its labelled product cannot escape.
It is assumed that all the reversible compartments must be in equilibrium with plasma, i.e. the ratio of the concentrations of radiopharmaceutical in plasma and in reversible tissue compartments must remain stable. In these circumstances only the accumulation of radiopharmaceutical in irreversible compartments is affecting the apparent distribution volume. In practise, this can happen only after the initial sharp concentration changes when the plasma curve (input function) descends slow enough for tissue compartments to follow.
If there is no irreversible binding in the tissue, the resulting Patlak plot becomes horizontal, with slope of zero. In this case MTGA for reversible uptake (Logan plot) could be applied instead to calculate the distribution volume.
Making Patlak plot
When the equilibrium is achieved, the Patlak plot becomes linear. The slope of the linear phase represents the net transfer rate Ki (influx constant). To make it simple, Ki represents the amount of accumulated radiopharmaceutical in relation to the amount of radiopharmaceutical that has been available in plasma.
Operational equation for the Patlak plot is
where linearity is achieved after the distribution volume of the reversible compartments, included in the intercept (Int) is effectively constant (Logan, 2000). The y axis of plot contains apparent distribution volumes, that is the ratio of concentrations of radiopharmaceutical in tissue and in plasma, as a function of time. On x axis is normalized plasma integral, that is the ratio of the integral of plasma concentration and the plasma concentration.
This method was actually first applied by Rutland (1979), and then by Gjedde (1982), but formal representation of the analysis method was published by Patlak & Blasberg (1983 and 1985).
The y axis intercept of the Patlak plot involves tissue blood volume fraction and distribution volumes, in unknown proportions, and may be affected by input function (Laffon-Marthan et al., 2021). Therefore its use as relevant clinical parameter is limited. Yet, it may be useful for estimating and correcting for the highly variable tissue fat and lung air volume fractions which otherwise could cause large bias for example in liver and lung PET studies.
Patlak plot analysis requires that sufficiently long dynamic PET scan is performed, and that arterial plasma curve is measured starting from the radiopharmaceutical administration until the end of the PET scan. Blood sampling is not necessary, if the input function can be measured from the dynamic PET image.
Dual-time point Ki
If two static late-scans can be performed, and input function can be measured from the PET images, then it may be possible to estimate Ki (and subsequently metabolic rate) from that dual-time point (DTP) data alone (van den Hoff et al., 2013; Wu et al., 2021).
Late dynamic scan
If input function is derived from dynamic image, but scan was not started at administration time and input peak is thus missing, relative Patlak plot can be calculated, providing relative Ki image. Ki estimates are not quantitative, but comparable to true Ki values with a single scaling factor, and these parametric Ki images can be used in lesion detection and SPM (Zuo et al., 2018).
Single late-scan
If only one late-scan can be performed, but plasma data is available for the whole time, starting from the time of radiopharmaceutical administration, and a population average of the Patlak plot intercept is applicable, then Ki can be calculated by rearranging the operational equation for the Patlak plot:
, where CROI(T) and Cp(T) are the activity concentrations in tissue and plasma at the middle time of the PET frame. If the intercept is known to be small, but exact value for it is not available, it can be assumed to be zero; in that case, we end up with the equation for FUR, which is an approximation of Ki:
Patlak plot without plasma sampling
In brain PET studies it may be possible to have a reference region where irreversible compartments do not exist: for example cerebellum in FDOPA studies. In FDG studies this is not possible because all brain regions consume glucose. Reference region contains only reversible compartments, which also achieve an equilibrium with plasma. The reference region can be included in the model, and the plasma curve is cancelled out (Patlak and Blasberg, 1985). In practise, the only difference to the calculation using plasma input is that plasma curve is replaced with reference region curve.
The result is not the same when reference input is used instead of plasma input. In the terms of traditional three-compartmental model,
with plasma input, but
with reference tissue input, assuming that K1/k2 is similar in region of interest and in reference region. If k3≫k2 (transport or perfusion is the limiting step), then the slope represents k2.
Reference tissue input can be used also in analysis of dual time point data to calculate a surrogate parameter for Patlak Kiref (Alves et al., 2017)).
Metabolic rate
When the PET radiopharmaceutical is an analog of glucose (e.g. [F-18]FDG) or fatty acids (e.g. [F-18]FTHA) or other native substrate in the tissue, and it is metabolically trapped in tissue during the PET scan, the Ki can be used to calculate the metabolic rate of the native substrate. For example, in [F-18]FDG the Ki can be multiplied by the concentration of glucose in plasma, and divided by the appropriate lumped constant, to get an estimate of glucose uptake rate.
MTGA for reversible uptake (Logan plot)
MTGA methods for reversible uptake can provide estimates of equilibrium volumes of distribution (VT). If a reference region is available, then binding potential (BPND) can be calculated from the ratio of distribution volumes for the region of interest and reference region:
Operational equation for the Logan plot is
where linearity is achieved after the intercept (Int) is effectively constant (Logan et al., 1990, 2000 and 2003).
Tantawy et al. (2009) introduced a modified Logan plot for delayed scan protocols where the initial uptake of radiotracer is not measured.
Alternative Logan plot
An alternative form of the MTGA for reversible uptake (which looks more similar to the Patlak plot) is
, but this formulation would achieve linearity only after the true steady state condition is reached (Logan 2003), and to keep imaging session as short as possible this is therefore not commonly used. Zhou et al (2009) reintroduced this formulation (as "new plot"), because it avoids the noise-induced negative biases in the VT and BPND estimates of the traditional Logan plot formulation.
Logan plot without plasma sampling
When reference region is available, then VT ratio (distribution volume ratio, DVR) can be calculated directly without blood sampling by using reference region in place of the arterial plasma integral (Logan et al., 1996):
The population average of apparent k'2 (k2 of one-tissue compartment model or k2/(1+k5/k6) of two-tissue compartment model) must be determined from studies with plasma sampling. Fortunately, in many cases the term containing the population average of apparent k'2 can be omitted (Logan et al., 1996; Logan, 2003). Reformulation of the equation above to
shows that when ratio Cref/CROI becomes reasonably constant the k'2 effectively becomes part of the plot intercept.
The negative of the intercept, -Int', in the Logan plot with reference tissue input is the relative residence time (RRT), which can be used to measure the clearance of PET radiopharmaceutical from region-of-interest relative to reference region (Shoghi-Jadid et al, 2002).
PET data must be collected from the radiopharmaceutical injection time, because Logan plot method requires both tissue and input integrals starting from time 0. However, in some cases the analysis may be possible from late-scan data (Tantawy et al., 2009).
Alternative graphical analysis with reference tissue input
Based on the alternative Logan plot with plasma input, with its relatively bold assumptions, Zhou et al (2009) introduced "new plot" in form
which requires longer scan times but is less biased by noisy data.
For each radiopharmaceutical, the reference input methods have to be validated against plasma input methods. See for example Anteror-Dorsey et al. (2008).
Estimation of VND and VT
Yokoi et al (1993) described a MTGA method for estimating VT, which was different from the Logan plot and the alternative Logan plot. Operational equation for the "Yokoi plot" is
In case of one-tissue compartmental model, the slope of the plot represents -k2, plots y axis intercept (Int) represents K1, and x axis intercept is the VT. This method can be used for analysis of radiowater PET studies (Yokoi et al., 1993), but could be used for analysis of any reversible uptake data with fast kinetics.
If the plot becomes two-phasic with more steep negative slope in the beginning than in the end, then two-tissue compartmental model is needed to describe the kinetics of the radiopharmaceutical. If the two phases are clearly separable and a line can be fitted to both phases, then this two-phase graphic plot can be used to estimate both VND and VT, and BPND as VT/VND - 1 (Ito et al., 2010 and 2017). The x axis intercepts of the two fitted lines represent VND and VT.
Line-fitting in MTGA
Usually line-fitting in MTGA is done using traditional regression method, where it is assumed that plot data has errors only in y values. This assumption does not hold in MTGA, where actually both plot coordinates contain variation. Patlak and logan programs for regional MTGA also use traditional regression by default. Different line fitting methods can be selected optionally.
If tissue data consists of only few PET frames or even just one late scan, then it is impossible to fit regression line to the plots. Calculation of Fractional Uptake Rate (FUR) instead of Patlak plot should then be considered for radiopharmaceuticals with irreversible uptake.
Summary:
- Patlak plot for irreversible uptake, Logan plot for reversible
- Linearity of plots must be verified
- Plasma or reference region input can be used, depending on the radiopharmaceutical
- Outcome from Patlak plot is net influx constant Ki which may be used further to calculate metabolic rate, or Kiref in case of reference region input
- Outcome from Logan plot is distribution volume VT, or distribution volume ratio DVR in case of reference region input
- Easy and fast to calculate pixel-by-pixel from dynamic PET images to produce Ki or VT images
See also:
- Interpretation of Patlak plot by Lars Jødal
- Patlak plot from regional TACs with plasma input
- Patlak plot from regional TACs with reference tissue input
- Patlak plot and long time frames
- Logan plot from regional TACs with plasma input
- Logan plot from regional TACs with reference tissue input
- Calculation of Patlak plot for dynamic images
- Calculation of Logan plots for dynamic images
- Fractional Uptake Rate (FUR)
- Equations for graphical analysis of irreversible tracers (Gjedde-Patlak plot)
- Equations for graphical analysis of reversible tracers (Logan plot)
- Logan plot calculated in Excel, example worksheet #1
- Logan plot calculated in Excel, example worksheet #2
Literature
Bass L, Keiding S, Munk OL. Benefits and risks of transforming data from dynamic positron emission tomography, with an application to hepatic encephalopathy. J Theor Biol. 2009; 256: 632-636.
Gjedde A. Calculation of cerebral glucose phosphorylation from brain uptake of glucose analogs in vivo: a re-examination. Brain Res. 1982; 257: 237-274.
Ito H, Yokoi T, Ikoma Y, Shidahara M, Seki C, Naganawa M, Takahashi H, Takano H, Kimura Y, Ichise M, Suhara T. A new graphic plot analysis for determination of neuroreceptor binding in positron emission tomography studies. NeuroImage 2010; 49: 578-586. doi: 10.1016/j.neuroimage.2009.07.021.
Ito H, Ikoma Y, Seki C, Kimura Y, Kawaguchi H, Takuwa H, Ichise M, Suhara T, Kanno I. Visual evaluation of kinetic characteristics of PET probe for neuroreceptors using a two-phase graphic plot analysis. Ann Nucl Med. 2017; 31: 273-282. doi: 10.1007/s12149-017-1155-6.
Logan J, Fowler JS, Volkow ND, Wolf AP, Dewey SL, Schlyer DJ, MacGregor RR, Hitzemann R, Bendriem B, Gatley SJ, Christman DR. Graphical analysis of reversible radioligand binding from time-activity measurements applied to [N-11C-methyl]-(-)-cocaine PET studies in human subjects. J Cereb Blood Flow Metab. 1990; 10: 740-747. doi: 10.1038/jcbfm.1990.127.
Logan J, Fowler JS, Volkow ND, Wang GJ, Ding YS, Alexoff DL. Distribution volume ratios without blood sampling from graphical analysis of PET data. J Cereb Blood Flow Metab. 1996; 16: 834-840. doi: 10.1097/00004647-199609000-00008.
Logan J. Graphical analysis of PET data applied to reversible and irreversible tracers. Nucl Med Biol. 2000; 27: 661-670. doi: 10.1016/S0969-8051(00)00137-2.
Logan J, Fowler JS, Volkow ND, Ding YS, Wang GJ, Alexoff DL. A strategy for removing the bias in the graphical analysis method. J Cereb Blood Flow Metab. 2001; 21(3): 307-320. doi: 10.1097/00004647-200103000-00014.
Logan J. A review of graphical methods for tracer studies and strategies to reduce bias. Nucl Med Biol. 2003; 30: 833–844. doi: 10.1016/S0969-8051(03)00114-8.
Logan J, Alexoff D, Fowler JS. The use of alternative forms of graphical analysis to balance bias and precision in PET images. J Cereb Blood Flow Metab. 2011; 31(2): 535-546. doi: 10.1038/jcbfm.2010.123.
Munk OL. Model-independent plot of dynamic PET data facilitates data interpretation and model selection. J Theor Biol. 2012; 295: 1-8. doi: 10.1016/j.jtbi.2011.11.004.
Patlak CS, Blasberg RG, Fenstermacher JD. Graphical evaluation of blood-to-brain transfer constants from multiple-time uptake data. J Cereb Blood Flow Metab. 1983; 3: 1-7. doi: 10.1038/jcbfm.1983.1.
Patlak CS, Blasberg RG. Graphical evaluation of blood-to-brain transfer constants from multiple-time uptake data. Generalizations. J Cereb Blood Flow Metab. 1985; 5: 584-590. doi: 10.1038/jcbfm.1985.87.
Rutland MD. A single injection technique for subtraction of blood background in 131-I-hippuran renograms. Br J Radiol. 1979; 52: 134-137.
Yokoi T, Iida H, Itoh H, Kanno I. A new graphic plot analysis for cerebral blood flow and partition coefficient with iodine-123-iodoamphetamine and dynamic SPECT validation studies using oxygen-15-water and PET. J Nucl Med. 1993; 34(3): 498-505. PMID: 8441045.
Zhou Y, Ye W, Brašić JR, Crabb AH, Hilton J, Wong DF. A consistent and efficient graphical analysis method to improve the quantification of reversible tracer binding in radioligand receptor dynamic PET studies. NeuroImage 2009; 44(3): 661-670. doi: 10.1016/j.neuroimage.2008.09.021.
Zhou Y, Ye W, Brašić JR, Wong DF. Multi-graphical analysis of dynamic PET. Neuroimage. 2010; 49(4): 2947-2957. doi: 10.1016/j.neuroimage.2009.11.028.
Tags: Logan plot, MTGA, Patlak plot, Ki, Volume of distribution, Yokoi plot
Updated at: 2023-06-08
Created at: 2008-04-02
Written by: Vesa Oikonen