Calculation of Logan plot for regional TACs with reference tissue input
Multiple-time graphical analysis (MTGA) for reversible tracers (Logan plot) with reference region input is used to the distribution volume ratio (DVR) of the PET tracer, which is related to binding potential (BPND): BPND = DVR - 1. DVR and BPND are unitless.
ROI drawing, calculation of regional TACs, and calculation of Logan plot, can all be done in Carimas™ or PMOD.
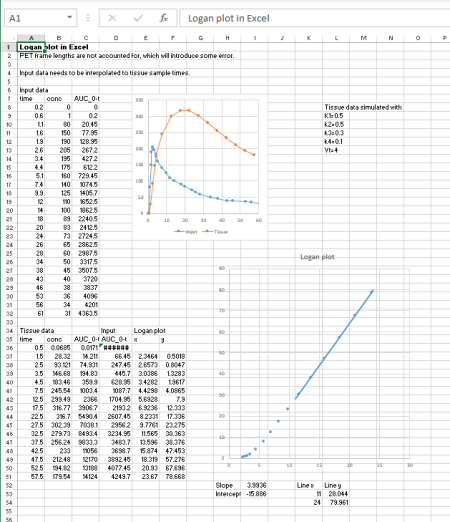
If there are more than just a few studies to analyze, then calculation in Excel is too slow and error-prone, and use of Carimas, PMOD, or command-line tools (below) is recommended.
Command-line software
As an alternative to Carimas, Logan plot can also be calculated using in-house command-line tools:
2. Preparation of regional tissue TAC data
Save the regional TAC files in the image analysis program, in DFT format with Carimas, or in TAC format in PMOD. Calculate averages over planes and regions if needed.
Reference tissue region can be included in the datafile with the other ROIs, or kept in a separate TAC file.
3. Computing the net uptake rate (Kiref)
The logan program can then be run with (at least) the following command-line parameters:
- regional tissue TAC file
- name of reference region inside the previous file, or, file name of TAC file which contains only the reference region TAC
- start time for the line fit (time where linear phase starts)
- end time for the line fit (time where linear phase ends, or end time of study)
- name for result file
With reference region input, the (population) average reference region k2
should be used to correct for the (small) time dependence of the ROI/reference ROI -ratio
(Logan et al, 1996).
This correction can be made with option -k2=X, where X is the average
k2 value determined from studies with plasma input.
For some radiopharmaceuticals, for example [11C]raclopride, this correction is not
necessary (Logan et al, 1996).
Control the linearity of plots
MTGA methods produce correct results only if the slope is calculated from the linear phase of the plot, excluding the curvature in the beginning. You should always draw the Logan plots and control the linearity and quality of the data visually.
See also:
- Logan plot from regional TACs with plasma input
- Calculation of Logan plots for dynamic images
- Equations for graphical analysis of reversible tracers (Logan plot)
- Reference region input compartmental models
References:
Logan J, Fowler JS, Volkow ND, Wolf AP, Dewey SL, Schlyer DJ, MacGregor RR, Hitzemann R, Bendriem B, Gatley SJ, Christman DR. Graphical analysis of reversible radioligand binding from time-activity measurements applied to [N-11C-methyl]-(-)-cocaine PET studies in human subjects. J Cereb Blood Flow Metab. 1990; 10: 740-747. doi: 10.1038/jcbfm.1990.127.
Logan J, Fowler JS, Volkow ND, Wang GJ, Ding YS, Alexoff DL. Distribution volume ratios without blood sampling from graphical analysis of PET data. J Cereb Blood Flow Metab. 1996; 16: 834-840. doi: 10.1097/00004647-199609000-00008.
Logan J. Graphical analysis of PET data applied to reversible and irreversible tracers. Nucl Med Biol. 2000; 27: 661-670. doi: 10.1016/S0969-8051(00)00137-2.
Logan J. A review of graphical methods for tracer studies and strategies to reduce bias. Nucl Med Biol. 2003; 30: 833–844. doi: 10.1016/S0969-8051(03)00114-8.
Tags: Logan plot, Excel, MTGA, Reference tissue
Updated at: 2020-11-19
Written by: Vesa Oikonen