Input function
Input function (delivery function) describes the concentration of the unchanged (non-metabolized) compound in arterial plasma as a function of time. Arterial plasma concentrations are independent of the site of blood sampling, while the venous concentrations are dependent of the clearance of compound in the vascular bed and thus the sampling site.
Normalizing tissue uptake
To make the measured tissue concentration in one study comparable to measurements in other studies we have to normalize the tissue concentration at least to the administered dose, and preferably also to the weight of study subject or animal; then we get Standardized Uptake Values (SUVs), which are already fairly well comparable between studies and subjects. However, there are several drawbacks in the SUV method, most importantly that SUV is time-dependent, and affected by different plasma clearance between subjects and study conditions: For example, when administered radiopharmaceutical is faster excreted to urine or metabolized by the liver or kidneys, then the amount of radiopharmaceutical available for the brain uptake is reduced, but this is not accounted for in the brain SUV. Also, when radiopharmaceutical uptake in certain organ(s), for example skeletal muscle, is decreased, then the amount of radiotracer available for uptake in myocardium is increased. Additionally, the administered dose can be overestimated because of extravasation.
Gold standard: Tissue concentration is normalized to cumulative arterial concentration from injection time to the measurement time (AUC0-t).
To achieve quantitative results from PET studies the measurement and preprocessing of the input function is as important as that of PET scanner data.
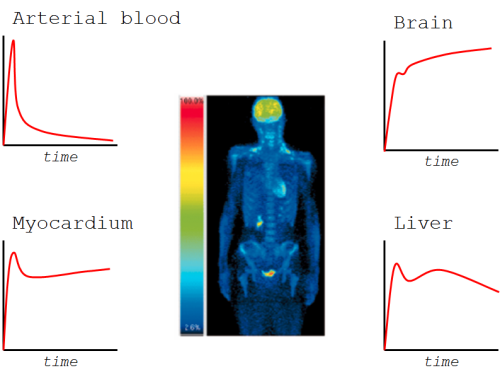
In tissue concentration curves, you first see the radioactivity inside the blood vessels in tissue (in vascular volume). At the same time the build-up phase of tissue uptake starts; it is mainly affected by perfusion and transport across endothelium and tissue cell membranes. Most of the radioligand then resides in extracellular space and as free radioligand in intracellular space.
After the free radioligand starts to flush away from tissue, we will start to see also the effects of specific uptake, like binding to receptors or metabolic trapping. Later, we may be able to see if the isotope label is trapped inside the cells or if it is released from the cells at some noticeable rate.
If we are scanning the brain, for example, and uptake in skeletal muscle, for example, is enhanced, then the end part of arterial curves will be lower, which will lead to lower uptake in the brain. This does not matter in the quantification of brain function, if we have measured the arterial curve, and can proportion the brain uptake to the integral of arterial curve.
Arterial plasma as input function
Procedure for measurement of arterial plasma input function:
- Manual blood sampling, or automated continuous sampling, from radiopharmaceutical administration time to the end of last PET scan
- Centrifugation of blood to separate plasma
- Plasma radioactivity measurement
- Radioactivity divided by sample mass or volume
- Decay correction to the time of injection
- Metabolite correction
- Dispersion and delay correction when necessary
In theory, input function for kinetic models must be continuous and noiseless. In practise, it must often be constructed from sparsely sampled blood concentrations, or from blood pool in dynamic PET image, available as mean concentration during each time frame. With frequent sampling, especially when using automatic blood sampling system, linear interpolation between sample points can be used to get concentration value or AUC at certain time. Spline fitting allows interpolation and reduce the noise (Bassingthwaighte et al., 1988; Beyer, 1992), but can produce bias if not carefully evaluated for different curves with variable noise and sampling times. Mathematical functions or compartment models can be fitted to measured plasma and blood time-activity curves (PTACs and BTACs) to reduce noise and to enable interpolation over long gaps (Graham, 1997), and even for extrapolation of the input function. Functions fitted to arterial PTACs can also be used in the development of model-based or population-based input functions.
Reference tissue as input function
Although arterial plasma is the gold-standard input function, and safe to collect (Jons et al., 1997), the process for obtaining it is burdensome and contains many sources of error. Therefore arterial plasma input is preferably replaced by reference tissue, if one exists.
The arterial plasma input function is the same to all organs and tissues. Therefore, a model including both region of interest and reference region can be developed, where the arterial concentration cancels out, and is thus effectively substituted by the reference tissue as input function.
Unfortunately there often is no reference region. For example glucose and FDG are taken up in all living tissues. Instead, when studying brain receptors, cerebellum often can be used as reference region; cerebellum also fits in to the brain PET image.
Even when there is no true reference tissue, it may still be possible to use the contralateral side (in the brain) or healthy parts of organ as reference, and calculate asymmetry index or SUV ratio as a semiquantitative uptake index.
See also:
- Preprocessing arterial input data
- Time-delay correction
- Dispersion correction
- Blood and Plasma TAC
- Venous blood sampling
- Metabolite correction
- Fitting PET input curves
- Extraction of blood TAC from PET image
- Population-based input function
- Compartmental models
- Circulatory system
Literature
Bentourkia M. Determination of the input function at the entry of the tissue of interest and its impact on PET kinetic modeling parameters. Mol Imaging Biol. 2015; 17: 748-756. doi: 10.1007/s11307-015-0895-8.
Budinger TF, Huesman RH, Knittel B, Friedland RP, Derenzo SE. Physiological modeling of dynamic measurements of metabolism using positron emission tomography. In: The Metabolism of the Human Brain Studied with Positron Emission Tomography. Raven Press, 1985. ISBN: 0-88167-056-1. pp 165-183.
Chen K, Huang SC, Yu DC. The effects of measurement errors in the plasma radioactivity curve on parameter estimation in positron emission tomography. Phys Med Biol. 1991; 36:1183-1200. doi: 10.1088/0031-9155/36/9/003.
Correia J. A bloody future for clinical PET? J Nucl Med. 1992; 32(4): 620-622. PMID: 1552351.
Huesman RH, Mazoyer BM. Kinetic data analysis with a noisy input function. Phys Med Biol. 1987; 32(12): 1569-1579. doi: 10.1088/0031-9155/32/12/004.
Munk OL, Keiding S, Bass L. Capillaries within compartments: microvascular interpretation of dynamic positron emission tomography data. J Theor Biol. 2003; 225: 127-141. doi: 10.1016/S0022-5193(03)00227-3.
Syvänen S, Blomquist G, Appel L, Hammarlund-Udenaes M, Långström B, Bergström M. Predicting brain concentrations of drug using positron emission tomography and venous input: modeling of arterial-venous concentration differences. Eur J Clin Pharmacol. 2006; 62: 839–848. doi: 10.1007/s00228-006-0179-y.
Tags: Input function, Administration, Blood, Plasma, Reference tissue, Modeling, Analysis
Updated at: 2019-01-01
Created at: 2014-04-08
Written by: Vesa Oikonen