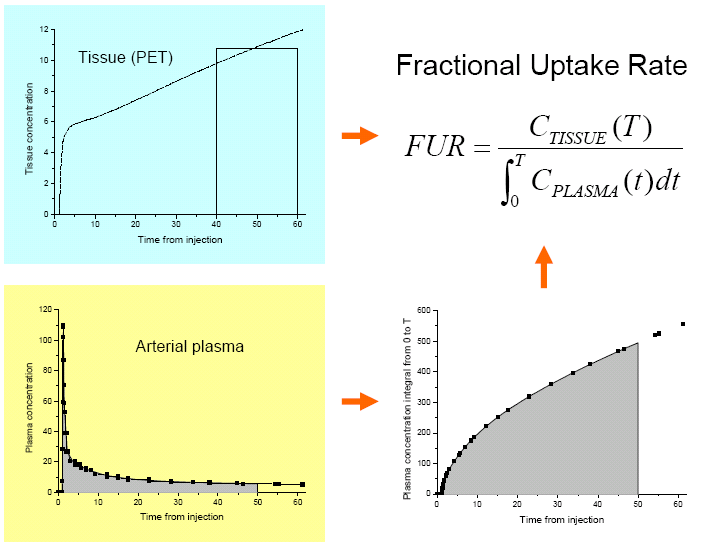
Fractional uptake rate (FUR)
FUR is a simple PET quantifier, calculated as a ratio of tissue activity CT at time T and integral of plasma activity CP from time 0 to T (Camici et al., 1986; Allman et al., 1993; Ishizu et al. 1994 and 1995; Rutland et al., 2000):
Thus the unit of FUR is min-1 (Thie, 1995), the same as for Ki , if both tissue and plasma concentrations are given per mL (=cm3). If FUR is multiplied by organ volume, the result represents organ's net plasma clearance (CL ) with units of (mL plasma)×min-1.
FUR can be calculated from a single late PET scan, like SUV, but blood sampling from the injection to the scan time is required.
Fractional uptake rate was previously called Retention index (Ri), especially in analysis of cardiac PET studies. This is discouraged, because the term Retention index has several other uses, also in nuclear medicine. PMOD/PKIN uses term 'Tracer Retention Fraction'.
FUR is an approximation to the Patlak plot (MTGA for irreversible uptake) slope Ki, to the extent that at large T (late time after injection) the effective distribution volume term in Patlak analysis is not important (y axis intercept is assumed to be 0). FUR and SUV are proportional, related by total plasma clearance rate and a dimensionless initial distribution volume (Thie, 1995).
Equation of FUR can be derived by rearrangement of the operational equation of the Patlak plot, assuming that the Patlak plot intercept is zero. If a population average for the Patlak plot intercept is applicable, then that can be used to calculate Ki from a single measured tissue activity as if using Patlak plot with fixed y axis intercept:
Simulations
Mathematical function that describes the population average of FDG concentrations in arterial plasma is used to create FDG PTAC at 3 s sample intervals. Tissue curve (TTAC) is simulated using the PTAC as input function, and irreversible 2TCM, with typical parameters for the brain grey matter: K1=0.09 mL*(min*mL)-1, K1/k2=0.41 mL*mL-1, and k3=0.11 min-1 (Fig 2a). Blood volume is not considered in this simulation (VB=0). With these parameters, net influx rate can be calculated from equation for Ki in 2TCM,
, giving value Ki=0.0300444 mL*(min*mL)-1. Patlak plot indeed gives a very precise estimate for Ki with these simulated TACs, if line fit is started from 15 min. Instead, FUR is overestimated, approaching the correct value, but not reaching it during 120 min (Fig 2b).


The bias in FUR, as compared to Ki, is not only dependent on the time of FUR calculation, but also on the intercept of the Patlak plot.
In case of an irreversible 2TCM, and assuming that VB=0, the theoretical y axis intercept of the Patlak plot can be calculated from the rate constants:
If we do the simulation again, this time with 15% lower and 15% higher k3, but keeping other rate constants as they were, we will get the TTACs shown in Fig 3a, and FURs as shown in Fig 3b. Patlak plot will again provide correct Kis (0.0300444, 0.02688, and 0.03293 mL*(min*mL)-1, respectively). The 15% change in k3 changes Ki -10.5% and +9.5%, and an opposite change in intercept (+11% and -9%, respectively). FUR overestimates Ki in all situations, but the overestimation is lower when k3 (and Ki) is increased (Fig 3c); thus true differences in Ki will be underestimated when FUR calculation is used.


In the next simulation, k2 is set to 15% lower and 15% higher value, but other rate constants are kept unchanged. This will provide the TTACs shown in Fig 4a, and FURs as shown in Fig 4b. Patlak plot will again provide correct Kis (0.0300444, 0.03338, and 0.02731 mL*(min*mL)-1, respectively). The 15% change in k2 changes Ki +11.1% and -9.1%, and causes a parallel but smaller changes in the intercept (+5% and -5%, respectively). FUR is overestimated in all situations, and not much dependent on the value of k3 (Fig 4c). Even though the effect is small, the smaller k2 (and increased Ki) leads to lower overestimation; thus true differences in Ki will be underestimated when FUR calculation is used, whether the change in Ki is due to changed k2 or k3.


The data and scripts used in these simulations are available in gitlab.utu.fi/vesoik/simulations.
Metabolic rate
When the PET tracer is an analog of glucose (e.g. [F-18]FDG) or fatty acids (e.g. [F-18]FTHA) or other native substrate in the tissue, and it is metabolically trapped in tissue during the PET scan, the FUR estimate, like influx rate (Ki) from Patlak plot, can be used to calculate the metabolic rate of the native substrate. For example, in [F-18]FDG the FUR can be multiplied by concentration of glucose in plasma, and divided by the appropriate lumped constant, to get an estimate of glucose uptake rate.
Obviously, the FUR-based metabolic rates contain the same bias as FUR itself when compared to metabolic rates based on Ki.
See also:
- Calculation of FUR image
- Calculation of regional FUR
- Area-under-curve (AUC) in PET
- Standardized Uptake Value (SUV, DUR)
- Patlak plot
- Carimas software
- Simulations in GitLab
References:
Allman KC, Stevens MJ, Wieland DM, Hutchins GD, Wolfe ER Jr, Greene DA, Schwaiger M. Noninvasive assessment of cardiac diabetic neuropathy by carbon-11 hydroxyephedrine and positron emission tomography. J Am Coll Cardiol. 1993; 22: 1425-1432. doi: 10.1016/0735-1097(93)90553-D.
Camici P, Araujo LI, Spinks T, Lammertsma AA, Kaski JC, Shea MJ, Selwyn AP, Jones T, Maseri A. Increased uptake of 18F-fluorodeoxyglucose in postischemic myocardium of patients with exercise-induced angina. Circulation. 1986; 74(1): 81-88. 10.1161/01.CIR.74.1.81.
Ishizu K, Nishizawa S, Yonekura Y, et al. Effects of hyperglycemia on FDG uptake in human brain and glioma. J Nucl Med 1994; 35:1104-1109. PMID: 8014665.
Ishizu K, Yonekura Y. Clarification of a fractional uptake concept – Reply. J Nucl Med 1995; 36:712.
Rutland M, Que L, Hassan IM. "FUR" – one size suits all. Eur J Nucl Med. 2000; 27:1708-1713. doi: 10.1007/s002590000.
Thie JA. Clarification of a fractional uptake concept. J Nucl Med 1995; 36: 711-712.
Tags: FUR, Retention index, Ki, Simulation, AUC, Patlak plot
Updated at: 2024-01-03
Created at: 2007-11-01
Written by: Vesa Oikonen