PET data
Positron emission tomography (PET) is an imaging method for quantitatively measuring biochemical and physiological processes in vivo by using radiopharmaceuticals (tracers) and by measuring the annihilation radiation using a coincidence detecting technique. PET is the most sensitive non-invasive functional imaging technique.
Physiologically active compounds are tagged with positron-emitting radionuclides, isotopes of oxygen, nitrogen, carbon or fluorine, while maintaining their biological properties. The labelled compounds are administered intravenously in tracer amounts (e.g., in nanomolar or picomolar quantities). Local rates of accumulation, fixation, or turnover of radiopharmaceutical in tissue are measured in absolute units of tissue concentrations from the cross-sectional PET images and represent quantitatively regional radiopharmaceutical tissue concentrations. From the tissue response to an arterial radiopharmaceutical input function, radiopharmaceutical kinetic models are developed that relate the kinetics of a radiopharmaceutical in tissue to the physiological process under study, allow description of the tissue kinetics in mathematical terms, and enable an operational equation to be formulated by which absolute rates of blood flow and metabolism can be calculated.
PET scanner can deliver quantitative images of radioactivity (Bq/voxel, or Bq/mL). The chemical identity of the labelled molecules is only known at the moment of injection. Due to metabolism in blood, in the tissue region of interest, and in other tissues, different labelled compounds are formed in the course of time. The relative amounts of different radioactive compounds in plasma can be measured from arterial blood samples as a function of time.
Quantitative images
PET scanner measures concentration of radioactivity (Bq/mL) as a function of time, producing quantitative 4D images that are stored in PET image files.
Data is quantitative, if signal-to-noise ratio is sufficient, and all the necessary corrections are implemented (attenuation, scatter, dead-time, calibration, movement, partial volume effect, etc).
Image visualization
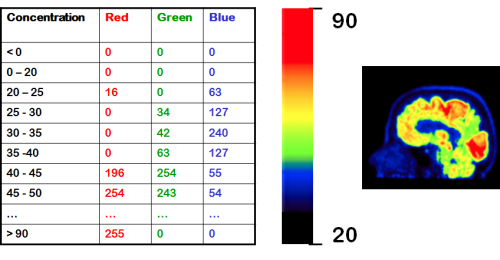
The PET images that you see in publications and presentations, are for visualization (or entertainment) purposes only. Colour scales have been enhanced at the expense of quantitation, just to please human eye and to emphasize certain structures and differences. Even if image is not manipulated on purpose, the process of producing image for visualization destroys the precision in the original PET image data. Concentrations in PET image file are real numbers in real units, but we have to assign a range of concentration values to a certain colour to show a colour image. Different colour scales (grey, rainbow, hot metal, ...) can be selected, and highest or lowest pixel values can be cut off.
Concentrations in PET
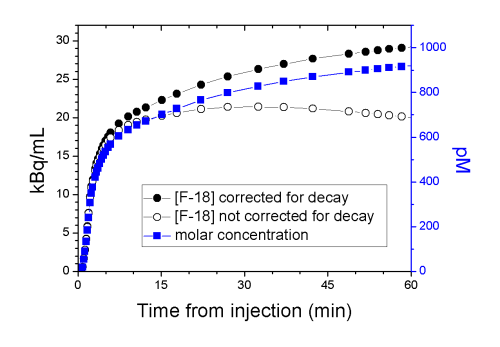
PET measures the concentration of radioactive label, for example isotope 18F. However, we are interested in concentration of a ligand, carrying the label, in tissues (pmol/mL). Measurement is based on observing the emitted gamma rays as the label decays. Ligand itself is not decaying. Measured radioactivity concentration must be corrected for the physical decay — only after that the radioactivity concentration is in proportion to ligand mass.
Radioactivity concentration at t=0, C(0), can be calculated from equation 1, where λ is:
As the label is decaying, the radioactivity measurement becomes more difficult. To compensate that, the duration of PET "frames" are extended to collect more data for each concentration measurement. Half-life of the isotope label, physiological clearance of the radiopharmaceutical, and sensitivity of the PET scanner determine how long the ligand concentration can be measured with PET. Long axis field of view PET scanners have markedly improved sensitivity, but that may limit the administered dose.
Radioactivity is proportional to mass
After decay correction, radioactivity concentration is proportional to the ligand concentration. The proportionality constant (molar activity, or specific activity) is measured at the time of radiopharmaceutical administration (t=0). With that we can convert the measured radioactivity concentration (Bq/mL) to the chemical concentration of the ligand in picomoles per litre.
Tissue uptake
The radioligand concentration in tissue is dependent on
- properties of tissue
- perfusion
- diffusion and transport across membranes
- nonspecific binding
- enzyme activities, receptor density and affinity
- properties of radiopharmaceutical
- specificity
- metabolism
- availability of radiopharmaceutical
- cumulative concentration in arterial blood or plasma (input function)
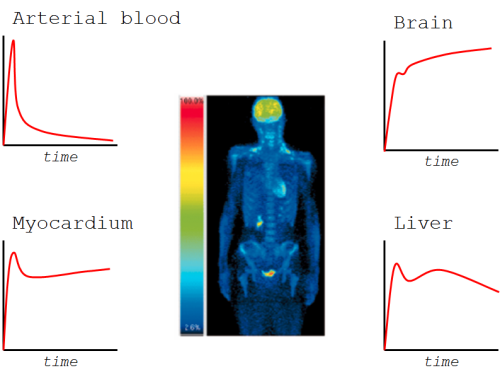
Concentration in blood or plasma is dependent on the administered dose, the route of radiopharmaceutical administration, and total clearance of the radiopharmaceutical.
Radiotracer concentration in tissue is related to the things which we are interested in studying, such as metabolic rate of glucose or receptor density, but also to confounding factors, such as perfusion. These are properties of the ligand as well — how specific the radioligand uptake is to the phenomenon that we want to measure. For example, in resting skeletal muscle, low perfusion is limiting the uptake of most radioligands, even though our intention is to measure something else than perfusion, like protein synthesis. In the brain, multidrug efflux transporters may affect ligand brain uptake (Kroll et al., 2014). Kinetic modelling is the method of removing the effects of the confounding factors.
Radiopharmaceutical is usually also a target of metabolism, at least in the liver, and if radioactive metabolites are released to circulation, those may obscure the results if taken into the region of interest.
See also:
- Quantification of radioactivity
- PET image
- PETPACS
- Radioactivity measurement of blood samples
- Units of PET data
- Decay correction
- Branching factor
- Wikibook: Basic physics of Nuclear Medicine
Literature
Aide N, Lasnon C, Desmonts C, Armstrong IS, Walker MD, McGowan DR. Advances in PET-CT technology: An update. Sem Nucl Med. 2021. doi: 10.1053/j.semnuclmed.2021.10.005.
Bendriem B, Townsend DW (Eds.): The Theory and Practice of 3D PET. Springer, 1998, 168 p, ISBN 978-90-481-5040-3.
Dahlbom M (ed.): Physics of PET and SPECT Imaging. CRC Press, 2017. ISBN 978-1-4665-6013-0.
Khalil MM (ed.): Basic Science of PET Imaging. Springer, 2017. doi: 10.1007/978-3-319-40070-9.
Tags: Image, Radioactivity, Tracer
Updated at: 2021-12-05
Created at: 2013-12-17
Written by: Vesa Oikonen, Tuula Tolvanen