
Compartmental models
The physiological system of dynamic processes in the tissue of interest is decomposed into a number of compartments, which interact with each other.
Compartment
Compartment is a chemical species in a physical place.
For example, "labelled FDG molecules in brain extracellular space" is a compartment, and "labelled FDG molecules inside brain cells" is another compartment, and "labelled and phosphorylated FDG molecules inside brain cells" is a third compartment. But, "Brain cell" is not a compartment, nor is "phosphorylated FDG".
Inside a compartment the tracer is considered to be distributed uniformly.
By assumption, inside a compartment the tracer is evenly distributed: there is no diffusion or other barrier inside the compartment. If there would be a concentration difference inside a compartment, we would divide that compartment into two compartments.
If temporal resolution would be better than is usually the case in PET imaging, then distributed models may perform better than compartmental models.
In compartmental model:
- injected isotope exists in the tissue in a fixed number of physical or chemical states with specified interconnections among them; the arrows indicate the possible pathways the tracer can follow
- compartmental models can be described in terms of a set of linear, first-order, constant-coefficient, ordinary differential equations (ODE)
Change of tracer concentration in one of the tissue compartments is a linear function of the concentrations in all other compartments:
From the linearity follows that kinetic measurements are the convolution of the tracer input function and the response function of the system. If the input function is also known, the response function of the system can in theory be deduced by deconvolving the input function from the measured kinetics of the system.
Compartmental model is constructed from a fixed number of compartments. The positron emitting isotope label is located in these compartments in certain concentrations. Notice the word "label": with PET we are observing not only the parent radioligand, but also other label carrying molecules that may be formed inside the tissue (for example phosphorylation of FDG) or carried there via blood from other organs.
Catenary model is a one-dimensional chain of compartments, each connected only to the immediate right and immediate left, i.e. compartments are in series. Name comes from the Latin word for chain. Mammillary model (from the Latin word for breast) has a central compartment surrounded by others connected only to the central compartment (like a sow nursing piglets), i.e. compartments are in parallel. Mixed mammillary/catenary models are commonly used in nuclear medicine.
Application of compartmental model
Compartmental model equations can be used to do simulations of tissue data, and simulations are used to
- test simplified analysis methods and software
- fit compartmental model parameters from measured PET data
If metabolite corrected arterial blood curve and dynamic PET data are available from the time of injection to the time where all important changes in tracer kinetics have been observed, and the data is of sufficient quality, then it may be possible to estimate the parameters of a complete model describing the dynamic processes, including perfusion, blood volume in tissue vasculature, transport, specific binding, or reaction rate, etc. In practice this can be done only in very simple cases, e.g. with labeled water which just flushes in and out of tissue.
It is possible and desirable to either measure some of the parameters in separate studies, e.g. blood volume using [15O]CO, or constrain them to literature values, or to reduce the model. Most often there is no need to measure all the parameters, but just one key parameter which correlates with the desired property in usual conditions.
Plasma compartment
By convention, in the nuclear medicine literature, the first compartment is the concentration of the tracer in the blood or plasma pool.
To be exact, the the concentration in plasma is not a compartment of the model. The concentration of tracer in the plasma is a measured quantity, and applied to the compartment model as a known input function driving the system.
The metabolite corrected arterial plasma curve is the input to the compartment model. If the intravascular activity is accounted for in the calculation, the whole blood concentration, containing metabolites, should be used for that. If metabolite corrected plasma curve is used instead of uncorrected whole blood curve to correct for vascular blood volume fraction, blood contribution at late times is underestimated, which could result in the artificial presence of an apparent additional tissue compartment (Lammertsma, 2002).
Two-compartment model (one-tissue compartment model)
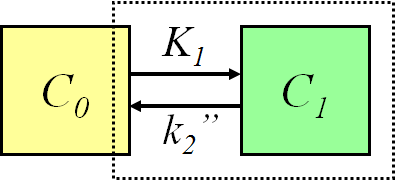
The simplest compartmental model is the two-compartmental model, or one-tissue compartmental model (1TCM). First compartment is for the input function, plasma or blood curve, which we have measured, and therefore we do not need an equation for that. The seconds compartment is for the isotope label in tissue. Compartments are connected with two rate constants, K1 and k2. The ordinary differential equation for calculation (simulation) of the change over time in the tissue compartment, C1, is:
Methods for quantitation of perfusion (blood flow, f) with freely diffusible tracers are based on two-compartmental model, and originally on Kety's analyses of the principles of inert gas exchange. Tracers such as [15O]H2O, [15O]butanol, [11C]butanol, and [18F]fluoromethane are used for this purpose.
Three-compartment model (two-tissue compartment model)
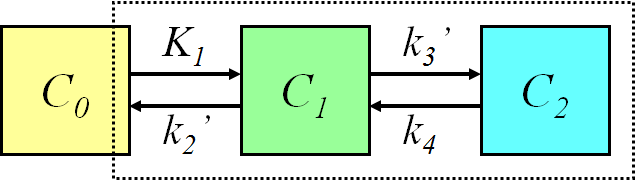
With two tissue compartments (2TCM), we need to have two ordinary differential equations to calculate the concentration curves in both of them:
For example, the kinetic model for measurement of glucose transport and phosphorylation rate in the brain using FDG is based on a three-compartment model. If tracer uptake is irreversible, we can set k4=0, which simplifies the differential equations.
Four-compartment model (three-tissue compartment model)
Three-tissue compartmental model, where two tissue compartments are in parallel:
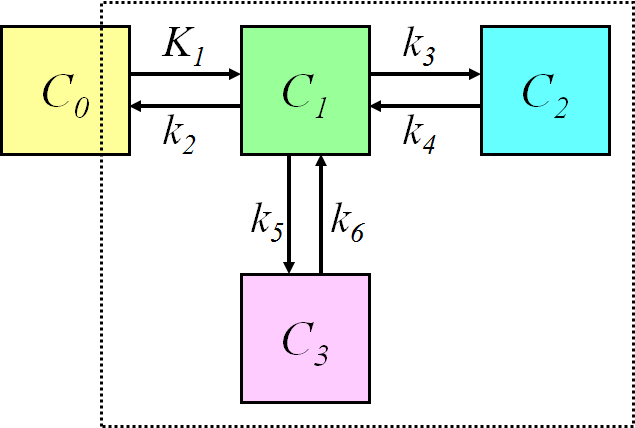
requires three ordinary differential equations
The compartmental models for brain receptor radioligands are usually based on this model. The two parallel tissue compartments are kinetically indistinguishable, therefore the model must be simplified, or some of the parameters constrained.
The three tissue compartments could be also in series; therefore it is important to specify the model structure and/or equations, not only the number of compartments.
Compartmental model for brain receptor studies
The description of the time course of the ligand in tissue requires a model that accounts for the different components contributing to the signal. These are free ligand in plasma, free ligand in tissue, CF, ligand in tissue which is not specifically bound, CNS, and ligand specifically bound to the receptor, CB (Schmidt and Turkheimer, 2002):
When the injected mass of the radioligand is so small that it itself does not lead to significant receptor occupancy (<5%), the rate constant k3 can be assumed to be a first-order rate constant, enabling linear differential equations to describe the dynamic tissue concentration data.
Use of 4-compartment model is not feasible given the large number of rate constants to be estimated, and the kinetically undistinguishable compartments for specific and nonspecific binding. The model is simplified under the assumption of a rapid equilibrium between the free and nonspecifically bound compartments that produces a single compartment of free + nonspecifically bound ligand:
Although for most ligands k3' and k4 cannot be estimated with a reasonable degree of accuracy, their ratio (related to compartmental volume of distribution) is usually more stable.
Compartments in series
The tissue compartments can be in series in metabolism studies when perfusion is limiting uptake more than transport across capillary endothelium.

The ordinary differential equations for the three-tissue compartmental model (where compartments are in series) are:
Net influx rate (Ki) can be calculated from rate constants of this and other compartmental models using equations given here.
K1 and k2
The first rate constant in compartmental models, K1, represents the unidirectional transport of the tracer from plasma or blood compartment to the first tissue compartment (delivery rate). Using the Fick principle and Renkin-Crone model (Renkin, 1959; Crone, 1963), K1 depends on perfusion, f (mL×mL-1×min-1), and the product of capillary permeability P (cm/min) and capillary surface area S (cm2/cm3), P×S:
Transport must happen during the time that the blood stays in the capillaries (1-3 s). Even if tracer resides in both blood plasma and blood cells, for many radioligands only the ligand that is in blood plasma is available for transport; then K1 depends on plasma flow instead of blood flow.The unidirectional transport back from tissue to the blood is depicted by rate constant k2. It is defined in terms of K1 and distribution volume of the tracer in the first tissue compartment:
In case of brain receptor model where the compartments for free (FT) and nonspecifically bound (NS) tracer in tissue are combined:
Both K1 and k2 are dependent on perfusion. Measurement of myocardial perfusion with [15O]H2O is even based on k2.
When K1 is strongly limited by the P×S of the capillary endothelium, as is the case in central nervous system because of the blood-brain barrier, it can be assumed that the first tissue compartment (C1) represents the interstitial and intracellular spaces, and the second tissue compartment (C2) represents either a metabolic or receptor-bound compartment inside the tissue.
Perfusion limited uptake
If P×S >> f (blood flow limited uptake), then e-PS/f=0 and K1=f. Accordingly, k2=f/V1, and CV(t)=C1(t)/V1. Assuming one-tissue compartmental model (k3=k4=k5=k6=0), this would equal the model for radiowater, where all tissue compartments are lumped into one because of the rapid diffusion of water in the tissues.
The liver is an example of an organ where the capillary endothelium has large openings and is very permeable to all radiotracers. Therefore, blood flow is the first limiting factor for uptake, and the first tissue compartment (C1) represents extracellular volume (including vascular and interstitial space). The second tissue compartment (C2) represents the intracellular space in hepatocytes, and the third tissue compartment in the model where compartments are in series (C3, if there is any) could represent a metabolic compartment inside hepatocytes. Thus, K1=f, and k3 and k4 represent the transport rates between extracellular and intracellular compartments. Similar model may apply to tissues, such as resting skeletal muscle, where the capillary endothelium is much tighter than in liver, but perfusion is very low.
Units of rate constants
Compartmental model rate constant denotes the fraction of the total tracer that will leave the compartment per unit time (fractional clearance). It has the unit of inverse time. Notice that rate constants can still have values over 1.0; if the concentration declines to zero, the flow of material will also be zero, since the amount of substance transferred per unit time is equal to the product of rate constant and the amount of tracer in the originating compartment.
K1 includes a perfusion-dependent component, which is indicated by using capital letter. K1 has units of millilitre plasma (or blood) per minute per millilitre tissue (mL min-1mL-1), whereas k2, k3, ... have unit per minute (min-1), indicating the fraction of mass transferred per unit time.
For example, if in 1-tissue compartmental model k2=0.05 min-1, the tracer leaves the tissue compartment at a rate of 5% per minute. If in two-tissue compartmental model k2=0.05 min-1 and k3=0.02 min-1, then the tracer leaves the first tissue compartment at a rate of 7% per minute. Of course, the concentration in the compartment is not decreased at this rate, if the tracer is replenished from plasma (K1) or from the second tissue compartment (k4).
See also:
- Distributed models
- First-order kinetics
- Fitting compartmental models
- Solving compartmental model ODEs
- Fick principle
- Compartmental model analysis of regional TACs
- Reference tissue input compartmental models
- Distribution volume
- PET data
- Input function
- Multiple-time graphical analysis (MTGA)
Literature
Anderson DH. Compartmental Modeling and Tracer Kinetics. Springer, 1983. ISBN 978-3-642-51861-4.
Budinger TF, Huesman RH, Knittel B, Friedland RP, Derenzo SE (1985): Physiological modeling of dynamic measurements of metabolism using positron emission tomography. In: The Metabolism of the Human Brain Studied with Positron Emission Tomography. (Eds: Greitz T et al.) Raven Press, New York, 165-183. ISBN 0-88167-056-1.
Crone C. The permeability of capillaries in various organs as determined by use of the indicator diffusion method. Acta Physiol Scand. 1963; 58: 292–305. doi: 10.1111/j.1748-1716.1963.tb02652.x.
Gjedde A, Bauer WR, Wong DF. Neurokinetics - The Dynamics of Neurobiology In Vivo. Springer, 2011, ISBN 978-1-4419-7408-2.
Gunn RN, Gunn RS, Cunningham VJ. Positron emission tomography compartmental models. J Cereb Blood Flow Metab. 2001; 21: 635-652. doi: 10.1097/00004647-200106000-00002.
Huang SC, Phelps ME (1986): Principles of tracer kinetic modeling in positron emission tomography and autoradiography. In: Positron Emission Tomography and Autoradiography: Principles and Applications for the Brain and Heart. (Eds: Phelps,M; Mazziotta,J; Schelbert,H) Raven Press, New York, 287-346. ISBN: 0-88167-118-5.
Ichise M, Meyer JH, Yonekura Y. An introduction to PET and SPECT neuroreceptor quantification models. J Nucl Med. 2001; 42:755-763. PMID: 11337572.
Lammertsma AA. Radioligand studies: imaging and quantitative analysis. Eur Neuropsychopharmacol. 2002; 12: 513-516. doi: 10.1016/S0924-977X(02)00100-1.
Laruelle M. Modelling: when and why? Eur J Nucl Med. 1999; 26: 571-572. doi: 10.1007/s002590050423.
Morris ED, Endres CJ, Schmidt KC, Christian BT, Muzic RF Jr, Fisher RE (2004): Kinetic modeling in positron emission tomography. In: Emission Tomography: The Fundamentals of PET and SPECT. (Eds: Wermick MN, Aarsvold JN). Elsevier Inc., pp 499-540.
Renkin EM. Transport of potassium-42 from blood to tissue in isolated mammalian skeletal muscles. Am J Physiol. 1959; 197: 1205–1210. doi: 10.1152/ajplegacy.1959.197.6.1205.
Robertson JS (ed.): Compartmental Distribution of Radiotracers. CRC Press, 2018. ISBN 978-1-315-15043-7.
Schmidt KC, Turkheimer FE. Kinetic modeling in positron emission tomography. Q J Nucl Med. 2002; 46:70-85. PMID: 12072847.
Slifstein M, Laruelle M. Models and methods for derivation of in vivo neuroreceptor parameters with PET and SPECT reversible radiotracers. Nucl Med Biol. 2001; 28:595-608. doi: 10.1016/S0969-8051(01)00214-1.
Watabe H, Ikoma Y, Kimura Y, Naganawa M, Shidahara M. PET kinetic analysis - compartmental model. Ann Nucl Med. 2006; 20(9): 583-588. PMOD: 17294668.
Wong DF, Gjedde A, Wagner HN Jr. Quantification of neuroreceptors in the living human brain. I. Irreversible binding of ligands. J Cereb Blood Flow Metab. 1986; 6: 137-146. doi: 10.1038/jcbfm.1986.27.
Wong DF, Young D, Wilson PD, Meltzer CC, Gjedde A. Quantification of neuroreceptors in the living human brain. III. D2-like dopamine receptors: theory, validation, and changes during normal aging. J Cereb Blood Flow Metab. 1997; 17: 316-330. doi: 10.1097/00004647-199703000-00009.
Tags: Modeling, Compartmental model, Convolution, Rate constant, Perfusion, Parameters, 1TCM, 2TCM, 3TCM, ODE
Updated at: 2023-07-01
Created at: 2007-09-26
Written by: Vesa Oikonen