Compartmental model fitting
Compartmental model equations can be used to do simulations of tissue TAC, and simulations are used to
- test simplified analysis methods and software
- fit (estimate) compartmental model parameters from measured PET data
Simulation of tissue curve is based on
- input function (usually arterial plasma TAC)
- compartmental model (ODEs)
- physiological model parameters
PET is used to measure the tissue TAC, which is the sum of the isotope label concentrations in all tissue compartments and blood in tissue vasculature. Simulated tissue TAC, CS(t) is calculated accordingly:
CB(t) is the radioactivity concentration in the blood, VB is the vascular volume fraction inside the region of interest, and Ci(t) is the radioactivity concentration in the ith tissue compartment.
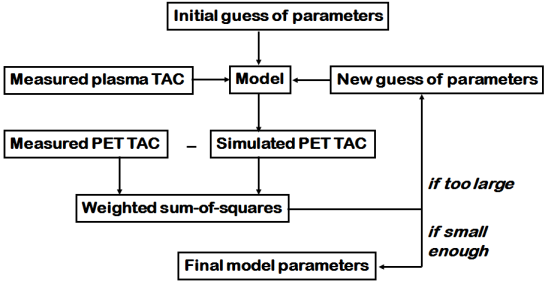
When we have the simulated tissue TAC, we can compare that curve to the tissue TAC that we have measured with PET (CPET(t)): At each time point (ti, we calculate the difference between measured and simulated tissue radioactivity concentration, square it, and sum all these together. That is the so called Sum-of-Squares (SS or Χ2):
, where p̂ is the set of compartmental model parameters that were used to simulate the tissue TAC, and wi are the weights for each data sample. If measurement variance is known,
, otherwise wi=1.
The smaller that is, the better match we have between the measured and simulated curves.
Optimization algorithm is used for iteratively moving from one set of compartmental model parameters (p̂) to a set of parameters, which provides smaller Χ2, until progress is stalled or until a fixed maximum number of iterations has passed. As a result of this non-linear least-squares (NLLS) method, we have estimates of the rate constants.
In addition to these ordinary and weighted least squares (OLS and WLS, respectively), the objective function to minimize by the iterative optimization methods can be be constructed in somewhat different ways: for instance penalized weighted least squares (PWLS), iteratively re-weighted least squares (IRLS), and extended least squares (ELS) have been studied (Muzic and Christian, 2006). Especially at high noise levels other methods than OLS or WLS tend to perform better (Sheiner and Beal, 1985; Spilker and Vicini, 2001; Muzic and Christian, 2006).
Outlier detection can be implemented in the optimization algorithm (Huang, 2008).
If the criterion function has multiple local minima, the iterative search may end up at any one of these, leading to more or less flawed model parameter estimates. Therefore we are often applying global optimization algorithms, although they take much more computation time.
If no constraints are imposed on the parameters, the minimum could correspond to a physically unrealisable set of parameters. Noise and inadequate handling of the vascular volume fraction in the initial phase of the tissue TAC may lead to "impulse phenomenon", where an initial peak in the data that actually is just noise is interpreted as representing very fast kinetics of the first tissue compartment, leading to improper rate constant estimates (Huang et al., 2018). At least negative parameter values would be non-physiological and should be ruled out.
Certain compartmental models can be linearized, and parameters solved using e.g. non-negative least-squares (NNLS) method.
Simultaneous estimation method (SIME)
One dynamic PET image contains several regions of interest, which usually are analyzed individually. Usually, however, we can assume that certain model parameters are common to all regions. If the TACs from several regions are fitted simultaneously, keeping the assumption of one or more common parameters, all of the parameters can in theory be estimated more reliably (Raylman et al., 1994; Huesman & Coxson, 1997). However, the number of parameters to fit in SIME methods can be very large, and many usual optimization methods do not work reliably. With modern computers, after extensive method refinement and testing, however, reliable results can be obtained.
The input function can be assumed to be the same for all regions, which is utilized in model-based input function estimation. Image-derived input function can be estimated from the LV cavity of the heart by simultaneously fitting the parameters of the input function, PVC, and kinetic model for the myocardial muscle, to the regional TACs of the myocardial muscle and cavity (Fang & Muzic, 2008).
In compartmental models for brain receptor radioligands, a common assumption has been that K1/k2 is the same in all grey matter regions. This can be directly used in SIME (Ogden et al., 2015; Plavén-Sigray et al., 2019).
See also:
- Compartmental models
- Solving compartmental model ODEs
- Multilinear models
- PET data
- Input function
- Reference tissue input models for regional TAC data
- Plasma input compartmental model analysis of regional TACs
- Model calculations for PET images
- AIC in model selection
- Plotting TACs
Literature
Dai X, Chen Z, Tian J. Performance evaluation of kinetic parameter estimation methods in dynamic FDG-PET studies. Nucl Med Commun. 2011; 32(1): 4-16. doi: 10.1097/mnm.0b013e32833f6c05.
Floudas CA, Pardalos PM (eds.): Encyclopedia of Optimization. 2nd ed., Springer, 2009.
Huang S-C. Detection of measurement outliers in tracer kinetics. IFAC Proceedings Volumes 2008; 41(2): 6654-6657. doi: 10.3182/20080706-5-KR-1001.01122.
Huang C-K, Wang W, Tzen K-Y, Lin W-L, Chou C-Y. FDOPA kinetics analysis in PET images for Parkinson's disease diagnosis by use of particle swarm optimization. 2012 9th IEEE International Symposium on Biomedical Imaging (ISBI), 586-589. doi: 10.1109/ISBI.2012.6235616.
Huesman RH, Coxson PG. Consolidation of common parameters from multiple fits in dynamic PET data analysis. IEEE Trans Med Imaging 1997; 16(5): 675-683. doi: 10.1109/42.640758.
Kadrmas DJ, Oktay MB. Generalized separable parameter space techniques for fitting 1K-5K compartment models. Med Phys. 2013; 40(7): 072502/16. doi: 10.1118/1.4810937.
Motulsky HJ, Ransnas LA. Fitting curves to data using nonlinear regression: a practical and nonmathematical review. FASEB J. 1987; 1: 365-374. doi: 10.1096/fasebj.1.5.3315805.
Muzic RF Jr, Christian BT. Evaluation of objective functions for estimation of kinetic parameters. Med Phys. 2006; 32(2): 342-353. doi: 10.1118/1.2135907.
Raylman RR, Hutchins GD, Beanlands RSB, Schwaiger M. Modeling of carbon-11-acetate kinetics by simultaneously fitting data from multiple ROIs coupled by common parameters. J Nucl Med. 1994; 35: 1286-1291. PMID: 8046480.
Sederholm K. Globaali optimointi positroniemissiotomografia-kuvantamiseen liittyvässä mallintamisessa. Pro gradu, 2003. PDF.
Yaqub M, Boellaard R, Kropholler MA, Lammertsma AA. Optimization algorithms and weighting factors for analysis of dynamic PET studies. Phys Med Biol. 2006; 51: 4217-4232. doi: 10.1088/0031-9155/51/17/007.
Yaqub M, Boellaard R, Kropholler MA, Lubberink M, Lammertsma AA. Simulated annealing in pharmacokinetic modeling of PET neuroreceptor studies: accuracy and precision compared with other optimization algorithms. Nuclear Science Symposium Conference Record, 2004 IEEE. 5: 3222-3225. doi: 10.1109/NSSMIC.2004.1466368.
Young P: Everything You Wanted to Know About Data Analysis and Fitting but Were Afraid to Ask. Springer, 2005. ISBN 978-3-319-19051-8.
Tags: Modeling, Compartmental model, Fitting, Optimization algorithm, NLLS, Rate constant
Updated at: 2023-07-01
Created at: 2014-01-23
Written by: Vesa Oikonen