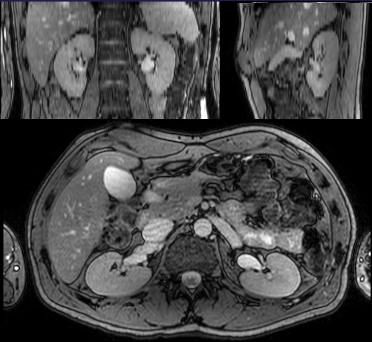
PET imaging of the kidneys
In adult humans the size of kidneys is approximately 11-12 × 5.0-7.5 × 2.5-3.0 cm, each kidney weighting 125-170 g in males and 115-155 g in females. Kidney volumes can be precisely measured using CT and MRI; kidney volumes measured with MRI are 132-276 mL in males and 87-223 mL in females (Cheong et al., 2007). MRI can be used for renal volume assessment and segmentation of renal compartments (Zöllner et al., 2012; Yang et al., 2016; Torres et al., 2018). Because of the position of the liver, the right kidney is located slightly lower than the left kidney. Respiration during imaging leads to considerable movement of kidneys, mainly in cranio-caudal direction (∼1 cm) (Yamashita et al., 2014). Image registration and normalization methods for dynamic renal MRI and PET are being developed (Zöllner et al., 2019; Rahman et al., 2019).
The nephron is the functional unit of the kidney, consisting of the vasculature, the glomerulus, and the tubular elements (proximal tubule, loop of Henle, distal tubules). Anatomically, glomerulus and its vasculature resides always in the cortex; for most nephrons, tubular element and its vasculature resides for most part in the cortex, but it can also extend deep into the medulla. Humans and rodents have more short looped than long looped nephrons. Some superficial nephrons in humans are very short, so that the loop of Henle does not enter the medulla at all. Renal corpuscle consists of the Bowman's capsule and the glomerulus inside of it. There are roughly one million nephrons in one human kidney (Nyengaard & Bendtsen, 1992), although the number varies widely (Bertram et al, 2011); and about 30000-40000 in a rat kidney. Total glomerular volume in one kidney is ∼4 cm3 (Nyengaard & Bendtsen, 1992), that is, ∼3% of the volume of the kidney. The size of glomeruli is variable, with average diameter of 0.2 mm in humans and 0.12 mm in rats. Filtration surface area is ∼0.2 m2 per kidney (Guasch & Myers, 1994).
The outer layer of the kidney, cortex, is about 1 cm thick, forming a cap for each of the 8-18 renal pyramids of the medulla. Kidneys are surrounded by a fibrous capsule, and that is surrounded by an adipose capsule. Glomeruli are located in the cortex. Renal artery branches into arcuate arteries, which traverse through medulla to the cortex, branching there further into interlobular arteries, and further into afferent arterioles. Afferent arterioles lead the blood into the glomeruli, and efferent arterioles from the glomeruli into the tubules. Glomerulus is supplied by a single afferent arteriole, and drained by a single efferent arteriole. Peritubular capillaries of the cortical nephrons are also (for the most part) inside the cortex. 10-15% of the glomeruli are located closer to the medulla, belonging to juxtamedullary nephrons that have, in addition to the tubules and peritubular capillaries inside the cortex, also tubular loops of Henle protruding long distances into the medulla. The loops of Henle and collecting ducts are vascularized by vasa recta, deriving from efferent arterioles from the cortex, and returning to cortex. Straight segments of distal tubules and their collecting ducts from the cortex travel through the medulla and attach to the base of the renal pyramid, extending towards the renal pelvis, the upper part of the urinary tract. Collecting ducts, ascending vasa recta and thin limbs run parallel, appearing as interstitial nodal spaces (INSs) in transverse sections. Papillae between the distal ends of the collecting ducts and the calyces of the renal pelvis, renal pelvis itself, and ureters contain smooth muscle that contracts rhythmically to direct the urine to the bladder. In rat kidneys, the volume of pelvis is ∼7%, medulla ∼16%, and cortex ∼77% (Reuter et al., 2009).
In healthy adults, the kidneys and heart are the organs with the highest resting metabolic rates. Renal oxygen consumption and mitochondrial content are second only to the heart (Bhargava & Schnellmann, 2017). Renal blood flow (RBF) is very high: kidney is the most vascularized organ of the body, and kidneys receive 20-25% of the resting cardiac output, while their weight is less than 1% of body mass. Total blood flow into kidneys is about 1000-1200 mL/min, and renal plasma flow (RPF) is typically 650 mL/min. All that blood passes first through the glomeruli. Blood flow in outer cortex is 5-6 mL/(g*min), in inner cortex 2-3 mL/(g*min), and in outer and inner medulla about 1 and 0.5 mL/(g*min), respectively (Verma & Molitoris, 2015). Oxygen consumption of the kidneys is about 2.7 mmol O2/(kg*min), and about 95% of oxygen is consumed in the cortex. Due to the high perfusion, and arteriovenous O2 shunting, the oxygen extraction fraction in the kidney is low, about 0.10. Due to the oxygen shunting, PO2 is lower in both proximal and distal tubules than in renal vein (Wilcox et al., 2013). Oxygen extraction remains stable when renal perfusion changes (Levy, 1960; Larsson et al., 2018), because increased perfusion leads to increased Na+ load, and therefore increased demand for oxygen to drive reabsorption of Na+. In humans, the renal cortex corresponds to about 80% of the renal mass. Kidney volume is reduced in ARAS patients, mainly due to reduction in cortical volume. Lymphatic system starts from the cortex, below the fibrous capsule, and drain along the veins. Lymphatic flow rates are low, 0.5-3.0 mL/h in sheep (McIntosh & Morris, 1971).
Medullary blood flow constitutes about 5-15% of total renal blood flow; although perfusion is lower than in renal cortex, it is still higher than in the brain and similar to the liver. Capillary density and surface area is much higher in the medulla than in the cortex at least in the mice, and higher than in the heart muscle or liver. Perfusion is highest in the inner stripe just below the cortex. Inner renal medulla receives less than 1% of the total renal blood flow, but changes in this region can still have major effect on Na+ and water homeostasis and control of arterial blood pressure (Cowley et al., 1995). Perfusion in the medulla is difficult to measure because of the complexity of the microcirculation in the medulla, and that medullary blood flow comes from the cortex via glomeruli and efferent arterioles. Only very small fraction of blood bypasses the glomerular microcirculation before entering the medulla; this may be mainly caused by transformation of some glomeruli into non-capillary shunt vessels (Navar et al., 2011). The juxtamedullary afferent and efferent arterioles are larger than the cortical arterioles, and the juxtamedullary efferent arterioles have thicker smooth muscle layer, suggesting that blood flow into medulla is well controlled. Hematocrit in vasa recta is only about half of the hematocrit in the systemic circulation. Lymphatics are few or missing in the healthy medulla (Ishikawa et al., 2006; Yazdani et al., 2014), probably because of the similar function of vasa recta, but appear in fibrotic tissue (Sakamoto et al., 2009); in mouse diabetes models, lymphatic vessels appear in the medulla, and are more numerous and larger also in the cortex than in normal mice (Uchiyama et al., 2013). The loops of Henle have limited water permeability. Different methods have provided highly variable results (Zimmerhackl et al., 1985b; Pallone et al., 1990).
The kidneys have important roles in glucose homeostasis: glucose is not only reabsorbed from glomerular filtrate into the blood, but renal gluconeogenesis provides additional glucose during post-absorptive (fasting) state (Wilding, 2014; Alsahli & Gerich, 2017). Kidneys produce also other compounds, including amino acids and glycocyamine (creatine precursor) (Jang et al., 2019).
Kidneys function as oxygen and haematocrit sensor, and produce most of the EPO in the body.
Acid-base homeostasis is maintained largely by the kidneys via bicarbonate (HCO3-) reabsorption and bicarbonate generation. Bicarbonate and Cl- are the major anions in blood plasma. Kidneys normally reabsorb almost all of filtered bicarbonate, but when necessary (for instance vegetarian diets), can excrete bicarbonate and other alkali, such as citrate and 2-oxoglutarate, to prevent metabolic alkalosis. Tubular uptake of citrate via dicarboxylate transporter NaDC1 is partially regulated by calcium sensing receptor (CaSR) because citrate functions as a chelator in urine, preventing crystallization of calcium oxalate and phosphate. Bicarbonate generation involves production and excretion of ammonia (NH4+) by the kidneys. Over 97% of urinary ammonia is produced by the kidneys from amino acid metabolism. In hypokalemia, ammonia is produced and excreted in excess, leading to alkalosis. Metabolic acidosis often develops in chronic kidney disease. Since generation of ammonia is linked to gluconeogenesis, metabolic acidosis leads to increased glucose production by the kidneys, which contributes to the impaired glucose tolerance.
Renal cortex has very high oxygen consumption, used to produce energy from substrates such as lactate, free fatty acids, glutamine, and citrate. Glucose and ketone bodies (β-hydroxybutyrate and acetoacetate) are used in the medulla and in distal collecting tubules of the cortex, but not much in the proximal tubules in normal conditions. All nephron segments can use lactate and FFAs (Mudaliar et al., 2016).
Glomerular filtration barrier
Glomerular barrier at the glomerular capillary loops contains size- and charge-selective filters, preventing the excretion of blood cells and molecules larger than 60-70 kDa (hydrodynamic diameter >5-6 nm) into the urine. Glomerular filtration is a passive process, dependent on the hydrostatic pressure.
The glomerular filtrate is then processed in the proximal convoluted tubules: necessary ions, glucose, amino acids, and most of the water are reabsorbed. Organic anions, K+, and H+ are left or secreted into the filtrate. Remaining albumin is taken up by an endocytotic process, together with its cargo. Most small molecules and proteins that are not bound to albumin are not reabsorbed. Urine albumin-to-creatinine ratio (UACR) >3.0 mg/mmol is an early marker of endothelial damage of the renal glomeruli, tubules, and endothelial dysfunction generally, and is associated with increased risk of hypertension, cardiac mortality, and cognitive decline (Sung et al., 2016; Ekblad et al., 2018).
Glomerular capillaries are highly fenestrated, but the fenestrations (60-80 nm in size) are covered by a 200-300 nm thick membrane-bound glycocalyx and endothelial cell coat (secreted proteoglycans, glycosaminoglycans, and plasma proteins, loosely attached to the glycocalyx) on the luminal side. Glomerular basement membrane (GBM) is another, slightly thicker, meshwork of extracellular matrix (ECM) that is situated in the peripheral capillary wall between glomerular endothelial cells and visceral epithelial cells (podocytes), and additionally between the podocytes and mesangial cells at the bases of the capillary loops. The cells also synthesize the components of the GBM. As the second layer of the capillary wall the GBM physically restricts the passage of large proteins into the filtrate, but it also functions as charge-selective filter, reducing the diffusion of negatively charged molecules. Cationized ferritin binds to GBM, and can be used as contrast agent in MRI to assess the number and volume of glomeruli (Baldelomar et al., 2018). Mesangial cells express mannose receptor (CD206), and CD206 binding radiopharmaceuticals such as [68Ga]IRDye800-tilmanocept could be used to study early phases of glomerular disease (Qin et al., 2019). Glomerulus is surrounded by Bowman's capsule, which also consists of ECM and podocytes, and participates in the permselectivity of the filtration barrier.
Albumin is small enough to pass the glomerular filter in considerable amounts, and its negative charge only partially reduces the excretion; excreted albumin is reabsorbed from glomerular filtrate in the proximal tubules (Eppel et al., 2001; Sarav et al., 2009; Dickson et al., 2014). Albumin (and other plasma proteins) can be taken up by proximal tubule cells (mainly S1 cells just after the glomerulus) via endocytosis, and then either degraded in the lysosomes or moved from apical to basolateral membranes and further into the extracellular fluid and back to blood. Functional defects in glomeruli or proximal tubules will lead to proteinuria (or albuminuria) (Dickson et al., 2014).
Glomerular filtration rate
Glomerular filtration is the process of creating an ultrafiltrate of blood into the urinary space of the Bowman's capsule, as the blood flows through the glomerular capillaries. Glomerular capillaries are highly branched, with anastomoses. Glomerular filtration rate (GFR) represents the plasma (ultrafiltrate) volume presented to the nephrons per unit time. In humans the total glomerular capillary surface area is ∼ 1 m2. GFR is usually indexed to body surface area (BSA) to allow inter-individual comparisons. High capillary pressure and hydraulic permeability of the glomerular capillary wall contribute to the high GFR, ∼ 125 mL/min/1.73 m2, or in average healthy humans 120 mL/min, thus filtration fraction (FF=GFR/plasma flow) is normally about 20%, that is, about one-fifth of blood plasma becomes filtrate that enters the renal tubule. GFR <60 mL/min/1.73 m2 for at least three months has been used a criterion for chronic kidney disease. After tubular reabsorption, the urine flow rate is only about 1 mL/min.
GFR is considered the best overall index of kidney function (renal function), which also includes tubular function. Measurement of GFR is not simple: it can be measured (mGFR) indirectly as the clearance of administered (bolus infusion) filtration markers, or estimated (eGFR) from serum levels of endogenous filtration markers. Endogenous filtration markers are substances that body produces at a relatively constant rate, such as creatinine, urea, and cystatin C. Exogenous filtration markers are substances with relatively low molecular weight that are not protein bound, not reabsorbed, secreted, or metabolized by the tubules, and mainly eliminated from the circulation by glomerular filtration; for instance inulin, [51Cr]EDTA, and [99mTc]DTPA have been used for this purpose. [68Ga]DOTA could be used to measure GFR with PET. [68Ga]EDTA and [55Co]EDTA have also been used to assess GFR (Yamashita et al., 1988 and 1989; Goethals et al., 2000; Van de Wiele et al., 2000; Hofman et al., 2015), and can be used also in small animals (Gündel et al., 2018). [68Ga]DTPA is not suitable for quantitative GFR assessment because of strong binding to plasma proteins (Gündel et al., 2018). Renal [18F]F- clearance can be used as an index of GFR (Schnöckel et al., 2008). 2-deoxy-2-[18F]-fluorosorbitol ([18F]FDS) is a promising PET tracer for imaging kidney function (in addition to infection imaging); it is easy to produce from [18F]FDG, it is metabolically stable, has minimal plasma protein binding, and shows rapid cortical accumulation and excretion in healthy kidneys, and slow renal accumulation in renal failure model, and delayed uptake with no transit into collecting system in UUO model (Wakabayashi et al., 2016; Werner et al., 2018 and 2019). MRI techniques can provide quantitative mGFR values with excellent reproducibility (Kline et al., 2018). In animal models, GFR can be measured transcutaneously, applying kinetic model that includes the tracer injection and distribution in plasma (Friedemann et al., 2016).
Single nephron glomerular filtration rate oscillates with a fast (∼10 s per cycle) and slow (∼45 s) rate. Due to the tubuloglomerular feedback, the oscillations affect the whole nephron from Bowman's capsule to the collecting ducts, and renal cells are exposed to constantly exposed to stretch and shear stress (Peti-Peterdi et al., 2015).
Renal function is proportional to the size of kidneys, which is proportional to body surface area (BSA). In inter-individual comparisons the GFR must be adjusted to BSA (Sandilands et al., 2013).
Renal clearance
Renal plasma clearance (CLR ) of a drug is the virtual volume of plasma from which drug is completely removed per unit time by the kidneys, independent of other pharmacokinetic processes (Tucker, 1981). It can be defined as the product of renal plasma flow (QR ) and the renal extraction ratio (ER ):
If drug is eliminated from system only via glomerular filtration, the renal plasma clearance and urinary clearance are equal. Both can then be assessed via plasma sampling or urinary collection. Urinary collection is prone to errors, providing less precise results as calculation of clearance from plasma measurements. Urinary clearance can be higher than GFR if the drug undergoes tubular secretion (Peters, 1998).
If the fraction of unbound drug in plasma (fp ) is known, GFR and CLR are related by equation
While it is generally considered that only free drug in plasma can be excreted to urine, plasma protein bound drug and/or drug in erythrocytes may also be available for tubular excretion, if equilibration of free drug in plasma between these components is rapid.
Tubular function
Proximal tubular mass constitutes over half of the kidney volume, and most of the cortex. Tubules are supported by basement membrane. In adults the length of proximal tubule is about 12 mm. Proximal tubules have high density of mitochondria and consume lot of oxygen, mainly used for Na+ reabsorption (Lassen et al., 1961), mediated by Na+/K+-ATPase. Sodium is the major cation of the plasma. Under normal physiological conditions 99% of Na+ is reabsorbed, 60-70% in the proximal tubule, 25-30% in the thick ascending limb of the loop of Henle, and <10% in the distal convoluted tubule and collecting ducts (Palmer & Schnermann, 2015). Tissue [Na+] can be assessed using MRI (Grist et al., 2021). ∼80% of renal O2 consumption is used to drive the Na+/K+-ATPase. Yet, the concentration of sodium remaining in urine is about the same as other cations combined. Due to the high demand for ATP, proximal tubules rely mostly on aerobic β-oxidation of fatty acids in their energy metabolism. Proximal tubules have low capacity for anaerobic ATP production, making them more vulnerable to injury than distal tubules and most other structures of the kidney. Hypoxia can induce the expression of glycolytic enzymes in proximal tubules. In animal studies, specific molecular targeting of proximal tubules leads to AKI, and when repeated, to CKD (Chevalier, 2016). However, with appropriate treatment, the function of the medulla can be ameliorated.
To conserve water, urine is concentrated several fold above plasma osmolality (up to 4-5 fold in humans, or 15-20 fold in some rodents) (Bankir & Yang, 2012). Urine osmolality can vary a lot, depending on the water balance of the body. Plasma osmolality is determined mainly by [Na+], with additional contribution by glucose and urea. Tubular endothelium contains membrane transporters, ion channels, and water pores. Proximal tubule reabsorbs 60-90% of the water and solutes. Organic anion transporters (OATs) and organic cation transporters (OCTs) can move their substrates from peritubular blood vessels into the tubular cells of the proximal nephrons, and other transporters such as MRP2 can then excrete the substrates into the urine. Nucleoside and peptide transporters prevent their substrates from entering the urine. Activity of peptide transporter PepT2 in mouse kidney could be studied with [11C]glycylsarcosine (Nabulsi et al., 2005). Water is reabsorbed in the proximal tubule by Aquaporin AQP1 and in the connecting and collecting ducts by Aquaporin AQP2. Binding of vasopressin to type 2 vasopressin receptors in the thick ascending loops of Henle and collecting ducts leads to accumulation of AQP2 in the apical plasma membrane, increasing water permeability, which facilitates the osmotically driven reabsorption of water. Vasopressin stimulates Na+ reabsorption via sodium channel in cortical and outer medullary collecting ducts. Glucose is conserved in plasma by several transporters on the tubular endothelium, including ATP-dependent sodium-glucose transporters SGLT1 and SGLT2. SGLT1 transports also urea. GLUT1 and GLUT2 release glucose from tubular cells back to plasma. SGLTs and GLUTs can be studied using tracers with different substrate specificity (Szabo et al. 2011; Sala-Rabanal et al., 2016; Ghezzi et al., 2018; van der Hoek et al., 2022).
Small proteins and peptides that have passed the glomerular filtration barrier can reabsorbed through receptor-mediated and fluid phase endocytosis, and then either directly released into circulation or first catabolized in lysosomes. Megalin (Low-density lipoprotein-related protein 2, LRP2) is a membrane-associated endocytic receptor. Megalin and cubilin have central roles in clathrin-mediated endocytosis and subsequent metabolism of proteins in renal proximal tubular endothelial cells (De et al., 2014; Nielsen et al., 2016). Megalin can bind many substrates, including insulin, albumin and other carrier proteins, and toxic substances that can lead to injury of proximal tubular endothelial cells. The neonatal Fc receptor for IgG (FcRn) transports, in addition to IgG, also albumin from the filtrate back to circulation.
Glucose and most other substrates are reabsorbed in the proximal tubules, so that the tubular fluid that enters the renal medulla contains little substrates for medullary metabolism. Glucose is provided to the medulla by medullary blood flow from the cortex. In the inner medulla the perfusion and availability of oxygen is low, leading to mainly anaerobic metabolism and production of lactate. The vasculature that reaches inner medulla is organized in bundles, and mathematical models have suggested that the reason for this is to preserve oxygen and prevent hypoxia (Pannabecker & Layton, 2014). The volume fraction of ECM increases towards the inner medulla and papilla (Genovese et al., 2014).
Urea is the end-product of protein metabolism, mainly formed in the urea cycle in the liver. In blood plasma, the concentration of urea is relatively low (4-10 mM). Urea is concentrated in urine up to 100 fold above its plasma concentration in humans, and even more in rodents. Urea, and water, can diffuse rapidly from descending vasa recta via UT-B and AQP1 to the ascending vasa recta in the outer medulla. Urea may be actively excreted in the medullary pars recta (Bankir & Yang, 2012). Vasopressin activates urea transporters in the terminal inner medullary collecting ducts, increasing interstitial concentration of urea, and reabsorption of water. Intrarenal urea cycling helps in reabsorption of water and concentration of other solutes. Protein-rich meal increases glucagon and cAMP levels in blood, which increase GFR and reduce reabsorption of urea (Bankir et al., 2018).
Tubules and urinary tract are exposed to concentrated levels of toxic substances. Tubular epithelium contains at least cytochrome P450 mono-oxygenases, reductases, hydrolases, sulfotransferases, UDP-glucuronosyltransferases, glutathione-S-transferases, methylases, and acetylases. These enzyme systems help in excreting harmful substances and drugs, but can also form nephrotoxic substances from originally harmless molecules.
Renal scintigraphy
Renal scintigraphy (renogram) using 99mTc-mercaptoacetyltriglycine (99mTc-MAG3) or 99mTc-DTPA and dynamic CT or SPECT is commonly used for measurement of renal function. Renal function includes glomerular filtration and tubular function. In healthy kidneys, proximal tubules excrete 99mTc-MAG3 efficiently via MRP2 and MRP4. Initial increase (∼ 2 min) in renal radioactivity provides an index of renal perfusion and tubular uptake, and is proportional to GFR; the descending phase is used to assess the tubular excretion. Fitting of the rising part provides renal output efficiency (OE) (Chaiwatanarat et al., 1993). 99mTc-MAG3 has replaced the use of [131I]OIH in measurement of effective renal plasma flow (ERPF). Split renal function (SF) is calculated by comparing the tracer accumulation during the first 2 minutes, divided by the total accumulation in both kidneys (Frennby et al., 1995 and 2001; Summerlin et al., 2008).
Static scintigraphy can be performed using 99mTc-DMSA and 99mTc-glucoheptonate (Blaufox et al., 2018).
Fluorine-18-labelled PET tracers for ERPF measurement are being developed (Lipowska et al., 2018; Wang et al., 2019). The pharmacokinetic properties of Re(CO)3([18F]FEDA) are similar to the [131I]OIH. Many PET radiopharmaceuticals developed for other purposes are excreted mainly to urine, and could be used for imaging renal function. The initial phase of FDG study may provide indices of ERPF and GFR, comparable to MAG3 scintigraphy (Geist et al., 2018 and 2019). PSMA radioligands such as [68Ga]PSMA-11 and [18F]PSMA-1007 can provide similar results as renal scintigraphy (Rosar et al., 2020; Valind et al., 2021).
EBCT
Electron beam computed tomography (EBCT) has been used to monitor the transit of contrast agent bolus through the vascular and tubular compartments. Transit times in nephron segments can be quantified, and perfusion can be estimated by dividing the tissue peak value with aortic AUC (Lerman et al., 1996; Rodriguez-Porcel et al., 1997).
Regulation
Renal autoregulation stabilizes RBF and GFR during changes in renal perfusion pressure (RPP). Changes in mean arterial blood pressure within the autoregulatory range (90-200 mmHg) have minimal effect on RBF and GFR (Kennedy-Lydon et al., 2013). The tone of cortical afferent arterioles regulates the renal vascular resistance according to the changes in RPP. The efferent arterioles may contribute to regulation of GFR only when RPP is very low (Carlström et al., 2015). Renal autoregulation is mediated by myogenic response and tubuloglomerular feedback, and is largely independent of neuronal and hormonal systems, except for the RAS. The smooth muscles at the afferent arteriole walls respond to elevation of pressure by vasoconstriction, and to drop in pressure by vasodilation; this "myogenic response" is found in most terminal blood vessels of the body, but in the kidneys its response time and pressure buffering capacity is larger than elsewhere. Tubuloglomerular feedback system is specific to the kidney: terminal part of the afferent arteriole is in contact with the tubular wall, at the end of the loop of Henle and the beginning of the distal tubule; this section of tubular wall contains specialized [Cl-] sensing cells (macula densa); increasing [Cl-] leads to signals that constrict the afferent arteriole, causing reduction in glomerular filtration, which enables increase in the extraction fraction of Na+ (and Cl-) in the ascending limbs of the loop of Henle. Nearby nephrons are coupled in the autoregulation, giving rise into complex dynamic behaviours, which can be modelled with nephron network models (Oien & Aukland, 1991; Sgouralis & Layton, 2015).
Sympathetic efferent nerve terminals directly contact the renal vascular walls, tubules, and juxtaglomerular granular cells which synthesize and release renin into afferent arteriole just before glomerulus. Renal sympathetic nerve activity (RSNA) decreases renal blood flow and GFR, increases renal tubular Na+ and water reabsorption, and increases renin release. Sympathetic nerve fibres start from the spinal cord, and from the ganglia they come together with renal artery to the hilus, and divide into bundles following the divisions of the arterial tree. The primary neurotransmitter of sympathetic nerves is noradrenaline, but many co-transmitters, including ATP and neuropeptide Y, are released concomitantly (Johns et al., 2011; Johns & Ahmeda, 2014). Sympathetic efferent innervation of renal vasculature is adrenergic, and changes of noradrenaline concentration in urine and renal arteriovenous difference has been used to assess the renal sympathetic activity. α- and β-adrenoceptors are abundant in kidneys. Dopamine D1 receptors are widely distributed, while D2Rs are localized in nephrons and presynaptic nerve terminals where they inhibit release of noradrenaline (Sata et al., 2018). Renal afferent nerves send feedback to central autonomic nuclei, where the signals modulate central sympathetic activity. Majority of afferent nerves originate in the proximal ureter, large vessels, and renal pelvis. Afferent nerves are sensitive to stretch and many metabolites (Converse et al., 1992). Renal sympathetic denervation (RSDN) has been tested as a treatment option for patients with drug-resistant hypertension (Krum et al., 2009; Kandzari et al., 2018), with variable efficacy results. Selective renal afferent denervation may be effective in decreasing blood pressure and preventing the progression of CKD. Regeneration of renal nerves may cause a time-dependent efficacy of RSDN (Sata et al., 2018).
Both the afferent and efferent arterioles are innervated by the sympathetic nervous system. Renal nerves are involved in beat-to-beat dynamic regulation of renal blood flow (Schiller et al., 2017). Pericytes, smooth muscle-like cells with contractile capacity, are wrapped around capillaries, primarily on descending vasa recta in the outer medulla. ATP and noradrenaline (NA, norepinephrine, NE) cause constriction of vasa recta via pericytes; both ATP and NE are released in response to sympathetic nerve stimulation (Crawford et al., 2013). Pericytes regulate angiogenesis, and contribute to the build-up of extracellular matrix, and have a major role in the development of renal fibrosis (Kennedy-Lydon et al., 2013; Kramann & Humphreys, 2014; Verma & Molitoris, 2015).
Renin-angiotensin or renin-angiotensin-aldosterone system (RAS or RAAS, respectively) regulates [Na+] in plasma, affecting fluid balance and arterial blood pressure. At the base of the internal carotid artery the dilated area, carotid sinus, contains baroreceptors, which connect via brain stem to the hypothalamus, affecting the activity of the sympathetic and parasympathetic nervous systems. Baroreceptors are found also in other arteries, including aortic arch. Juxtaglomerular cells (modified pericytes) in the glomerular capillary) can detect changes in the local blood pressure, [Na+] in the filtrate, and are affected by the sympathetic tone. Reduced blood pressure and [Na+], and increased sympathetic tone, causes juxtaglomerular cells to release more renin. Renin is an enzyme which cleaves a 10 amino-acid long peptide, angiotensin I, from plasma α-2-globulin (angiotensinogen, produced by the liver and proximal tubule cells). Endothelial cells contain angiotensin-converting enzyme (ACE), which converts angiotensin I into angiotensin II. ACE activity in kidney and lung can be measured with 4-cis-[18F]fluorocaptopril ([18F]FCAP) (Hwang et al., 1991; Markham et al., 1995). ACE2 may be assessed using [68Ga]NOTA-PEP4 (Parker et al., 2021). Angiotensin II binds to angiotensin receptors, causing vasoconstriction, release of aldosterone from adrenal glands; aldosterone increases Na+ reabsorption, increasing the blood pressure. Chronically elevated angiotensin II level leads to medullary microvascular dysfunction and hypoxia, which can be prevented with P2X7R antagonist (Menzies et al., 2015). RAAS is physiologically modulated by changing the expression of angiotensin II type 1 receptors (AT1Rs). ACE inhibitors and AT1R antagonists are commonly used for treating diabetic nephropathy, hypertonia, and congestive heart failure. Angiotensin II type 2 receptors (AT2Rs) forms heterodimers with relaxin family peptide receptor 1 (RXFP1), which are essential for the antifibrotic effects of relaxin. Angiotensin II type 2 receptors (AT2Rs) are also found in the inner membranes of mitochondria, activating respiration, and increasing membrane potential and ROS production. Medullary cells can produce prostaglandins to counteract the vasoconstrictor effect of angiotensin II.
Vasopressin regulates water excretion and medullary blood flow via vasopressin type 1A and type 2 receptors, which have different distribution in the tubular system and collecting ducts. Vasopressin also affects the contractility of pericytes, reducing lumen diameter and blood flow in descending vasa recta. Thus vasopressin has a key role in regulation of Na+ and water balance and arterial blood pressure (Kim & Pannabecker, 2010). Vasopressin reduces renal blood flow and increases oxygen consumption and oxygen extraction fraction (Bragadottir et al., 2009). Nephrogenic diabetes insidus (NDI) is a condition where kidneys cannot respond to vasopressin, leading to excretion of high volume of dilute urine. Urinary tract obstruction, electrolyte disturbances, and drug treatments (especially lithium) can cause NDI.
Endothelin (ET) is a potent vasoconstrictor, affecting vascular smooth muscle cells via endothelin receptor ETA. This effect is counteracted by ETB receptors, abundant in the medulla: endothelial cells release NO in response to activation of ETB receptors, simultaneously removing ET from the blood. Endothelin-1 (ET-1), the best known of ET peptides, is synthesized in renal cortex by vascular endothelial and smooth muscle cells, mesangial cells, podocytes, and tubular epithelial cells; and in renal medulla in vasa recta, thick ascending limbs, and collecting ducts (Kohan et al., 2011; Pollock, 2013).
Several cell types in renal cortex and medulla contain NMDA receptors and group 1 mGluRs (subtypes of glutamate receptors of glutamatergic system). NMDAR activity stimulates vasodilation in the glomerus, influencing RBF and GFR (Dryer, 2015). NMDA receptors in the hypothalamus have a role in regulating vasopressin release and activity of sympathetic nervous system. Glutamate receptors on podocytes affect glomerular barrier integrity.
Adenosine receptors are widely expressed in the kidneys, regulating GFR and tubular reabsorption, contributing to renal autoregulation (Vallon and Osswald, 2009; Calström et al 2015). Adenosine concentration is increased in hypoxic tissues, and in the kidney this is seen as higher adenosine concentration in the medulla than in the cortex. Adenosine prevents inflammation via A2ARs (Vincet & Okusa, 2015). Increased caffeine intake is associated with higher GRF.
Mathematical models have been developed for the simulation of renal function and regulation (Layton, 2012; Sgouralis & Layton, 2015 and 2016; Hallow et al., 2017), recently even for creating virtual kidneys containing thousands of glomeruli and tubules for both superficial and juxtamedullary nephrons (Weinstein, 2015a and 2015b; Layton, 2017).
Renal perfusion imaging
Renal blood flow (RBF) maintains glomerular filtration, and is not regulated to maintain tissue oxygenation, like in most other tissues. Instead, marked arteriovenous oxygen shunting takes place via periglomerular shunts and limbs of vasa recta. Increased blood flow results in increased tubular Na+ load, and increased demand for O2 (Liu et al., 2017). Sympathetic activation reduces RBF and decreases cortical and medullary oxygenation (Kim et al., 2021). Enalapril is a vasodilator that increases renal blood flow but does not affect GFR; renal flow reserve can be measured by assessing renal perfusion using [15O]H2O PET before and after enalapril (Päivärinta et al., 2018). Adenosine reduces renal perfusion; Middlekauff et al. (1997a) measured cortical blood flow using [15O]H2O PET and reported that after 2 mg of adenosine the reduction was 12±2% and 18±3 after 4 mg of adenosine. Mild non-ischemic hand-grip exercise decreased cortical perfusion by 15±7% (Middlekauff et al., 1997a). Electrically induced biceps muscle contraction decreased perfusion from 4.2±0.1 to 3.7±0.1 mL/(min*g) in healthy subjects, and from 3.0±0.1 to 2.4±0.1 mL/(min*g) in heart failure patients (Middlekauff et al., 2001). Stress during the PET scan should be avoided, because the sympathetic nerve activity can cause marked reduction renal perfusion; Middlekauff et al (1997b) reported that induced mental stress reduced cortical renal blood flow by ∼30%. Metformin reduces blood pressure by increasing Na+ excretion via reduced phosphorylation of Na+-Cl--cotransporter (Hashimoto et al., 2018); therefore metformin medication could affect renal perfusion. Sodium and water intake, and medications, must be standardized in renal studies to avoid confounding effects (Abumoawad et al., 2019).
Bolus infusion technique has been used to measure renal perfusion with PET using [82Rb]Rb+ and [13N]NH4+. Their extraction rate becomes limiting factor at high blood flow, but these tracers can still provide good perfusion maps for diagnostic purpose. [82Rb]Rb+ is a K+ analogue, and could be used in K+ transport studies; hypokalemia increases urinary excretion of [82Rb]Rb+ (Jochumsen et al., 2020).
[15O]H2O has high extraction rate and as a freely diffusible tracer it can be used in both bolus and steady‐state imaging protocols to measure renal perfusion.
[18F]F- has been used in small animal studies as an indicator of renal blood flow or GFR.
[64Cu]PTSM and [64Cu]ATSM have been used as perfusion tracers, also in kidneys (Shelton et al., 1990; Young et al., 1994; Nishikawa et al., 2023). Cu-labelled ETS would be better suited for measurement of high perfusion rates, like in the kidney, because its albumin binding is much lower than that of PTSM (Green et al., 2011). Green et al., 2007 validated renal perfusion measurement with [64Cu]Cu-ETS in pigs against microsphere method.
In animals, microspheres can be used to measure glomerular blood flow and its cortical distribution (Stein et al., 1971; Sabto et al., 1978; Aukland, 1980). Microspheres cannot be used to measure medullary blood flow, because they are trapped in the pre-glomerular and glomerular blood vessels. Highly invasive 133Xe and 85Kr washout method has been used to assess renal perfusion (Thorburn et al., 1963; Ladefoged et al., 1965), also in humans (Ladefoged & Pedersen, 1967; Hollenberg et al., 1974 and 1976; Porter et al., 1998).
Blood volume in tissues can usually be measured with [15O]CO-PET, but the method requires an estimate of local blood haematocrit (HCT), which is not well known in the human kidney, but it is markedly higher in the superficial than in deeper cortex and medulla because of plasma skimming (Ulfendahl, 1962; Pallone et al, 2012). Ladefoged & Pedersen (1967) calculated that the range of intrarenal HCT in men is 69-107% (mean 88.5%) of the large vessel HCT. In rats, HCT in the cortex and outer medulla is ∼85-95% and in inner medulla ∼45-60% of HCT in large vessels (Rasmussen, 1973). The sum of plasma and RBC volumes (total blood volume) was ∼10% in the cortex, ∼25% in the outer medulla, and ∼35% in the inner medulla (Rasmussen, 1973, Fig. 1). Zimmerhackl et al (1985a) used video microscopy to calculate the dynamic HCT in descending and ascending vasa recta of rats; HCTs were 59±9 and 57±8% of the value in systemic circulation. HCT in vasa recta of golden hamster is less than half of HCT in systemic blood (Ullrich et al., 1961). In dogs, the HCT-ratio was 85% in vasa recta of outer medulla and ∼50% in inner medulla (Wolgast, 1973). Vasopressin increases renal haematocrit (RBC volume but not plasma volume), especially in the inner medulla (Rasmussen, 1975). Osmotic and water diuresis decreases haematocrit especially in the inner medulla; water diuresis increased only plasma volume, not RBC volume, in the medulla; total volume increased to ∼40% in outer medulla and ∼45% in inner medulla (Rasmussen, 1974, Fig. 1). In humans, Yamashita et al (1988 and 1989) used [15O]CO without local haematocrit correction, and reported blood volume of 10-20 mL/100 g. Blood volume was slowly decreasing with age, following equation VB = 18.8 - 0.0826 × age (Yamashita et al., 1990).
Renal blood flow (RBF) and blood volume (RBV) have also been measured using MRI. Schoenberg et al (2003) estimated that parenchymal blood flow was about 4 mL/(g*min) in normal kidneys and about half of that in kidneys with parenchymal damage; blood volume was 0.27 mL/g and 0.23±0.02 mL/g, respectively. Cortical perfusion was 2.8±0.7 mL/(g*min) in healthy subjects and 1.4±0.4 mL/(g*min) in CKD patients (McComb et al., 2016). Cortical and medullary blood flow is reduced in ARAS patients. Renal artery revascularization increases cortical blood flow, but not GFR (Saad et al., 2013). Magnetic resonance relaxometry (MRR) is suggested to be sensitive to renal perfusion, oxygenation, oedema, fibrosis, and hydration (Wolf et al., 2018). Arterial spin labelling (ALS) technique has provided reproducible cortical and medullary perfusion values that correlate well with other techniques (Odudu et al., 2018).
Methods for measurement of oxygen availability within the kidney have been reviewed by Evans et al (2008). Renal oxygen delivery (DO2) can be calculated as the product of RBF and arterial O2 concentration. Renal oxygen consumption could be calculated as the product of RBF and the [O2] difference between arterial and renal venous blood, which cannot usually be obtained. In cardiac surgery patient and septic shock patient groups, this method has provided values for renal oxygen extraction fraction of 0.093 and 0.119, and oxygen consumption of 10.8 and 10.3 mL/(min*1.73 m2) (Larsson et al., 2018). In AKI the hypoxia is prominent in medulla, while perfusion and oxygenation in the renal cortex may be normal or even increased. Medullary and urinary oxygenation correlate well (Lankadeva et al., 2016 and 2018); urinary pO2 measured at the tip of bladder catheter could be used to assess medullary hypoxia. Renal vascular oxygenation can be studied using BOLD-MRI (Pruijm et al., 2018; Hall et al., 2018), but because of oxygen A-V-shunting in the kidneys that may not be reliable measure of renal tissue oxygenation status. In vivo PET imaging of hypoxia in kidneys may be difficult, because the accumulation of hypoxia tracers requires lower pO2 than would be expected in kidneys, and tracers are excreted via kidneys (Hirakawa et al., 2017).
Renal metabolism
[1-11C]acetate has been used for imaging renal function. [1-11C]acetate PET can provide an index of renal perfusion, and oxidative metabolism (Shreve et al., 1995; Juillard et al., 2007; Mikkelsen et al., 2017; Normand et al., 2019).
Activity of mitochondrial complex I (MC-I) has been quantified in rat kidney using [18F]BCPP-BF.
[18F]FDG
[18F]FDG is usually considered not suitable for assessing renal glucose consumption because it is excreted into the tubular lumen and accumulated in the renal collection system and urine (Szabo et al., 2006). In contrast to glucose, 2-FDG is a poor substrate for SGLT1 and SGLT2 (Sala-Rabanal et al., 2016). Qiao et al. (2007 and 2008) and Garbarino et al (2014) have developed a model for estimating the excretive process and plasma clearance of [18F]FDG. Hato et al (2016) have observed in rats a three-fold increase in cortical [18F]FDG uptake after inhibition of tumour suppressor protein p53; the effect was localized to proximal tubules using intravital multiphoton microscopy of mice with fluorescent 2-DG. Rat PET data was analyzed using irreversible two-tissue compartmental model, using as input the image-derived blood curve from the LV cavity, converted to plasma assuming HCT of 45%. VB was set to 5%. Glucose uptake, calculated as K1k2/(k2+k3), multiplied with serum glucose concentration, was 0.65±0.14 mg×(100g×min)-1 (Hato et al., 2016). Distribution volume, calculated using Logan plot, was 1.2±0.2 (Lauritsen et al., 2020). In rat kidneys, FDG uptake in medulla is ∼2-fold higher than in cortex (Reuter et al., 2009).
Results of [18F]FDG studies for renal function assessment are not very promising (Hanssen et al., 2017), although the initial phase of renal FDG concentrations may provide indices of ERPF and GFR (Geist et al., 2018). Some of [18F]FDG is taken up into tubular epithelial cells by ATP-dependent sodium-glucose transporters (SGLTs) but [18F]FDG is not effectively released into circulation by GLUT, and is therefore effectively trapped in the tubular epithelium, leading to high "background" radioactivity (activity not related to the glucose consumption) in the kidneys (Szabo et al., 2006; Sala-Rabanal et al., 2016).
Proximal tubules in the renal cortex can convert lactate into glucose, and release it into the blood (gluconeogenesis) (Stumvoll et al., 1997); thus the uptake and phosphorylation of [18F]FDG in the kidney is reversible, like in the liver, which also must be taken into account in the analysis and interpretation of the results.
[18F]FDG may have a role in diagnosing and staging primary and metastatic renal cell carcinoma (Wahl et al., 1991; Krishnan et al., 2017), renal inflammation (Wan et al., 2018; Pijl et al., 2018), and acute renal allograft rejection (Lovinfosse et al., 2016; Hanssen et al., 2019).
Renal receptor imaging
AT1R
Availability of renal angiotensin II type 1 receptors (AT1Rs) can be measured using for example [11C]KR31173 (Mathews et al., 2004; Zober et al., 2006; Xia et al., 2008; Gulaldi et al., 2013; Feng et al., 2015), [11C]L-159884 (Kim et al., 1996; Szabo et al., 1998 and 2001; Owonikoko et al., 2004; Zober et al., 2008), [18F]FPyKYNE-losartan ([18F]fluoropyridine-losartan) (Hachem et al., 2016; Ismail et al., 2016 and 2017; Abreau Diaz et al., 2023), [18F]fluoropyridine-candesartan (Abreau Diaz et al., 2021), 18F-labelled AT1R antagonist irbesartan (Hoffmann et al., 2018), and valsartan derivative [18F]FV45 (Chen et al, 2018).
ET receptors
Endothelin receptor radioligands, such as [11C]L-753,037 (Aleksic et al., 2001), have been shown to specifically bind to ET receptors in the heart, lungs, and kidneys. The kidneys and liver are however difficult targets, because the kinetics may largely reflect renal excretion (Johnström et al., 2010).
Endocannabinoid system
Cannabinoid receptor 1 (CB2R) expression in kidneys is increased in patients with diabetes, IgA nephropathy, and acute interstitial nephritis, and in unilateral ureteral obstruction (UUO) mice model. CB1R has a role in activation of myofibroblasts. Also 2-arachidonoylglycerol, an endogenous ligand for CB1R, is increased in fibrotic kidneys (Lecru et al., 2015). Activation of CB1Rs reduces blood pressure but does not directly affect renal perfusion, while activation of CB2Rs increases renal cortical perfusion (Pressly et al., 2019). At present, cannabinoid receptor tracers have not been used for renal PET imaging.
PSMA
In normal renal parenchyma, some PSMA expression is detected in the brush borders and apical cytoplasm of a subset of proximal tubules, but not in Bowman’s capsule, capillaries of the glomeruli, or other vasculature. In renal neoplasms, PSMA expression is seen only in the tumour-associated vasculature, not in the tumour cells (Baccala et al., 2007). PSMA expression in proximal tubules is sufficient to cause marked renal uptake of PSMA ligands regardless of renal clearance of the ligand (Chen et al., 2008).
PSMA is overexpressed in prostate cancer but also in neovasculature of certain types of renal carcinomas, providing a target for imaging and therapy (Rowe et al., 2015; Sawicki et al., 2017; Ahn et al., 2019; Meyer et al., 2019; Raveenthiran et al., 2019; Yin et al., 2019). If renal cortex is carefully avoided in VOI drawing, [68Ga]PSMA-11 may identify aggressive pathological features of primary clear-cell renal cell carcinoma (Gao et al., 2020).
The renal uptake of PSMA radioligands can be reduced with mannitol, infused prior to and at the time of radioligand administration (Matteucci et al., 2017). Mannitol is not reabsorbed in the proximal renal tubules, and is rapidly excreted into urine with half-life of ∼15 min in the blood. Mannitol increases the osmolality of the filtrate, increasing excretion of water and reducing reabsorption of solutes.
See also:
- Atherosclerotic renal artery stenosis (ARAS)
- Chronic kidney disease (CKD)
- Acute kidney injury (AKI)
- Renin-angiotensin-aldosterone system (RAAS)
- Circulatory system
- Vasopressin
- Natriuretic peptides
- Heart
- Liver
- Inflammation imaging
- Kidney phantoms
Literature
Amoabeng KA, Laurila S, Juárez-Orozco LE, Marthinsen ABL, Moczulski D, Rebelos E, Dadson P. The utilization of positron emission tomography in the evaluation of renal health and disease. Clin Transl Imaging 2022; 10: 59-69. doi: 10.1007/s40336-021-00469-2.
Alpern RJ, Caplan MJ, Moe OW (eds.): Seldin and Giebisch's The Kidney - Physiology and Pathophysiology, 5th ed., Academic Press, 2013, ISBN: 978-0-12-381462-3.
Ashley C, Morlidge C (eds.): Introduction to Renal Therapeutics. Pharmaceutical Press, 2008, ISBN: 978-0-85369-688-9.
Arroyo JP, Schweickert AJ: Back to Basics in Physiology - Fluids in the Renal and Cardiovascular Systems. Elsevier, 2013, ISBN: 978-0-12-407168-1.
Aukland K. Methods for measuring renal blood flow: total flow and regional distribution. Ann Rev Physiol. 1980: 42: 543-555. doi: 10.1146/annurev.ph.42.030180.002551.
Beierwaltes WH, Harrison-Bernard LM, Sullivan JC, Mattson DL. Assessment of renal function; clearance, the renal microcirculation, renal blood flow, and metabolic balance. Compr Physiol. 2013; 3: 165-200. doi: 10.1002/cphy.c120008.
Blaufox MD (ed.): Evaluation of Renal Function and Disease with Radionuclides: The Upper Urinary Tract, 2nd ed. Basel, Karger, 1989. ISBN: 978-3-8055-4933-2.
Carlström M, Wilcox CS, Arendshorst WJ. Renal autoregulation in health and disease. Physiol Rev. 2015; 95: 405-511. doi: 10.1152/physrev.00042.2012.
Chade AR. Renal vascular structure and rarefaction. Compr Physiol. 2013; 3(2): 817-831. doi: 10.1002/cphy.c120012.
Chen Y, Fry BC, Layton AT. Modeling glucose metabolism and lactate production in the kidney. Math Biosci. 2017; 289: 116-129. doi: 10.1016/j.mbs.2017.04.008.
Evans L, Cowley A. Renal medullary circulation. Colloquium Series on Integrated Systems Physiology: From Molecule to Function, 2015; 7(3): 1-104. doi: 10.4199/C00136ED1V01Y201507ISP064.
Fogo AB, Cohen AH, Jennette JC, Bruijn JA, Colvin RB: Fundamentals of Renal Pathology. Springer, 2007. doi: 10.1007/978-0-387-31127-2.
Fogo AB, Kashgarian M: Diagnostic Atlas of Renal Pathology, 3rd ed., Elsevier, 2017. ISBN: 978-0-323-39053-8.
Hura C, Stein JH. Renal blood flow. Comprehensive Physiology 2011; 1129-1184. doi: 10.1002/cphy.cp080125.
Kennedy-Lydon TM, Crawford C, Wildman SS, Peppiatt-Wildman CM. Renal pericytes: regulators of medullary blood flow. Acta Physiol. 2013; 207(2): 212-225. doi: 10.1111/apha.12026.
Krishnan N, Perazella MA. The role of PET scanning in the evaluation of patients with kidney disease. Adv Chronic Kidney Dis. 2017; 24(3): 154-161. doi: 10.1053/j.ackd.2017.01.002.
Koeppen BM, Stanton BA: Renal Physiology, 5th ed., Elsevier, 2013, ISBN: 978-0-323-08691-2.
Layton AT, Edwards A: Mathematical Modeling in Renal Physiology. Springer, 2014, ISBN 978-3-642-27367-4. doi: 10.1007/978-3-642-27367-4.
Lee C-J, Gardiner BS, Ngo JP, Kar S, Evans RG, Smith DW. Accounting for oxygen in the renal cortex: a computational study of factors that predispose the cortex to hypoxia. Am J Physiol Renal Physiol. 2017; 313: F218-F236. doi: 10.1152/ajprenal.00657.2016.
Lerman LO, Textor SC (eds.): Renal Vascular Disease. Springer, 2014. doi: 10.1007/978-1-4471-2810-6.
Levey AS, Inker LA, Coresh J. GFR estimation: from physiology to public health. Am J Kidney Dis. 2014; 63(5): 820-834. doi: 10.1053/j.ajkd.2013.12.006.
Liu Y, Blaufox MD. Use of radionuclides to study renal function. In: Goligorsky MS (ed.): Methods in Molecular Medicine, vol 86: Renal Disease: Techniques and Protocols. Humana Press, 2003. doi: 10.1385/1-59259-392-5:79.
Lote CJ: Principles of Renal Physiology, 5th ed., Springer, 2012. doi: 10.1007/978-1-4614-3785-7.
Middlekauff HR, Nitzsche EU, Nguyen AH, Hoh CK, Gibbs GG. Modulation of renal cortical blood flow during static exercise in humans. Circulation Res. 1997a; 80: 62-68. doi: 10.1161/01.RES.80.1.62.
Middlekauff HR, Nguyen AH, Negrao CE, Nitzsche EU, Hoh CK, Natterson BA, Hamilton MA, Fonarow GC, Hage A, Moriguchi JD. Impact of acute mental stress on sympathetic nerve activity and regional blood flow in advanced heart failure. Implication for 'triggering' adverse cardiac events. Circulation 1997b; 96: 1835-1842. 10.1161/01.CIR.96.6.1835.
Murray AW, Barnfield MC, Waller ML, Telford T, Peters AM. Assessment of glomerular filtration rate measurement with plasma sampling: a technical review. J Nucl Med Technol. 2013; 41: 67-75. doi: 10.2967/jnmt.113.121004.
Navar LG, Arendshorst WJ, Pallone TL, Inscho EW, Imig JD, Bell PD. The renal microcirculation. Comprehensive Physiology 2011; 550-683. doi: 10.1002/cphy.cp020413.
Pallone TL, Robertson CR, Jamison RL. Renal medullary microcirculation. Physiol. Rev. 1990; 70(3): 885-920. doi: 10.1152/physrev.1990.70.3.885.
Pallone TL, Edwards A, Mattson DL. Renal Medullary Circulation. Compr Physiol., 2012; 2: 97-140. doi: 10.1002/cphy.c100036.
Paulev P-E, Zubieta-Calleja G: New Human Physiology, 2nd ed., Chapter 25: Renal Physiology and Disease.
Prieto MC, Gonzalez AA, Satou R, Kobori H, Navar LG. Renin-Angiotensin System. In: Handbook of Biologically Active Peptides, 2nd ed., Elsevier, 2013. doi: 10.1016/B978-0-12-385095-9.00204-9.
Quaia E (ed.): Radiological Imaging of the Kidney. Springer, 2011. doi: 10.1007/978-3-540-87597-0.
Schafer JA, Williams JC Jr. Transport of metabolic substrates by the proximal nephron. Ann Rev Physiol. 1985; 47: 103-125. doi: 10.1146/annurev.ph.47.030185.000535.
Schnellmann RG. Toxic responses of the kidney. In: Klaassen CD (ed.): Casarett and Doull's Toxicology: The Basic Science of Poisons, 8th ed., McGraw-Hill Medical, 2013, ISBN: 978-0-07-176922-8, pp. 665-690.
Skorecki K, Chertow GM, Marsden PA, Taal MW, Yu ASL, Wasser WG. Brenner & Rector's The Kidney. 10th ed. Elsevier, 2016. ISBN: 978-1-4557-4836-5.
Szabo Z, Mathews WB. Positron emission tomography imaging of the kidneys. In: Functional Imaging in Nephro-Urology. Taylor & Francis, 2006, pp 197-210. ISBN 9781841845111.
Szabo Z, Xia J, Mathews WB, Brown PR. Future direction of renal positron emission tomography. Semin Nucl Med. 2006; 36(1): 36-50. doi: 10.1053/j.semnuclmed.2005.08.003.
Szabo Z, Xia J, Mathews WB. Radiopharmaceuticals for renal positron emission tomography imaging. Semin Nucl Med. 2008; 38(1): 20-31. doi: 10.1053/j.semnuclmed.2007.09.008.
Szabo Z, Alachkar N, Xia J, Mathews WB, Rabb H. Molecular imaging of the kidneys. Semin Nucl Med. 2011; 41(1): 20-28. doi: 10.1053/j.semnuclmed.2010.09.003.
Taylor AT. Radionuclides in nephrourology, part 1: Radiopharmaceuticals, quality control, and quantitative indices. J Nucl Med. 2014; 55(4): 608-615. doi: 10.2967/jnumed.113.133447.
Werner RA, Chen X, Lapa C, Koshino K, Rowe SP, Pomper MG, Javadi MS, Higuchi T. The next era of renal radionuclide imaging: novel PET radiotracers. Eur J Nucl Med Mol Imaging 2019; 46(9): 1773-1786. doi: 10.1007/s00259-019-04359-8.
Zimmerhackl B, Robertson CR, Jamison RL. The microcirculation of the renal medulla. Circ Res. 1985b; 57(5): 657-667. doi: 10.1161/01.res.57.5.657.
Tags: Kidney, GFR, Hypertension, Aldosterone, Aquaporins, pH
Updated at: 2023-06-13
Created at: 2017-02-23
Written by: Vesa Oikonen