[18F]Fluoride ([18F]F-)
[18F]Fluoride was introduced as an agent for skeletal scintigraphy by Blau et al (1962) long before PET scanners. After developments in fluorine radiochemistry, 18F has been widely used to label numerous radioligands for PET, and in vivo radiometabolism of these can lead to circulating free [18F]F- which may hamper the quantification of the kinetics of the native radioligand.
18F-labeled NaF is increasingly used in PET imaging of human skeletal disorders with several indications (Beheshti et al., 2015). Fluoride incorporates into the bone at the site of bone formation and remodelling, but does not well represent bone density (Nawata et al., 2017). As a freely diffusible ion, after intravenous bolus infusion [18F]F- distributes from tissue capillaries into the extracellular fluid, and back. In soft tissues, organ-to-blood ratio generally remains <1 (Savisto et al., 2023). In the bone, fluoride ions are further exchanged with the hydroxyl ions in bone crystals (hydroxyapatite) to form fluoroapatite in the bone matrix:
After the initial exchange, F- begins to diffuse into deeper layers of bone, but this process is too slow to be observed in typical PET studies. Concentration of [18F]F- in the bone reaches maximum at 2-3 h after injection, and then begins to slowly decrease (Apostolova & Brenner, 2010).
[18F]F-, like 99mTc-labelled biphosphonates, have high affinity to hydroxyapatite, whether the hydroxyapatite is present in dead bone or hydroxyapatite implants. Bernhardsson et al (2018) demonstrated in a rat study that [18F]fluoride uptake was very high in implanted allogeneic dead bone fragments and hydroxyapatite granules, although no new bone was being formed in the implants.
[18F]F- uptake is increased in locations where osteoblasts and osteoclasts are activated, and perfusion is increased (Hawkins et al., 1992; Grant et al., 2008; Czernin et al., 2010; Savisto et al., 2023). The highest [18F]F- uptake is seen in trabecular bones, such as backbone, where metabolism and bone turnover is faster than in long bones. In knee region, cortical bone has the highest [18F]F- uptake, followed by subchondral bone, and lowest in trabecular bone, which represents the differences in perfusion (Haddock et al., 2019a). Exercise increases the bone perfusion and total fluoride uptake, but reduces the fluoride bone incorporation fraction (Haddock et al., 2019b). Bone metastases can be diagnosed using [18F]F- PET. Kidneys are usually well visible in [18F]F- images, because fluoride concentration is high in tubular and interstitial fluids, and most of fluoride is excreted in urine. Rapid clearance of fluoride from blood into urine and bone contributes to the high bone-to-background ratio and good image quality even shortly after injection. In renal dysfunction the fluoride excretion is decreased, increasing the fluoride concentration in the plasma and soft tissues.
Pharmacokinetics of [18F]F- is determined by its uptake in bone matrix and its excretion into urine. Plasma clearance is biexponential, with the first exponent describing bone uptake, and the second exponent the renal clearance (Krishnamurthy et al., 1976). Normally about half of the injected [18F]F- is taken up in bone (Grant et al., 2008). Fluoride ion is in pH dependent equilibrium with hydrogen fluoride (HF), which has very high permeability through lipid membranes, and can be reabsorbed by the kidneys. Renal clearance of [18F]F- is many fold higher than that of Cl-, but less than creatinine clearance (Carlson et al., 1960). [18F]F- is in equilibrium between plasma and interstitial space in tissues, as well as with red blood cells. Intracellular fluoride concentrations are typically lower than concentrations in plasma and extracellular fluid in the equilibrium. However, since perfusion is the limiting factor for tissue uptake after a bolus [18F]NaF infusion, the tissue concentrations are not in equilibrium with the concentration in arteries, but instead are increasing over time.
[18F]F- in the blood cells is lower than in blood plasma (Hawkins et al., 1992; Schiepers et al., 1997; Cook et al., 1999), but [18F]F- in the blood cells is also available for uptake by the bone and other tissues (Blake et al., 2001; Czernin et al., 2010), as the single-pass extraction of [18F]F- of blood by bone is close to 100%. The rate constant for efflux of F- from red blood cells is 0.3 s-1 at room temperature (Tosteson, 1959). [18F]F- is probably also distributed in immature red blood cells and granulocytes in the bone marrow (Hawkins et al., 1992).
Tissue-to-plasma ratio is very low in the brain and fat tissue, but close to 1 in the liver and lung of rats; in the water space of heart muscle the ratio is about 0.5 (Whitford et al., 1979). Fluoride concentration gradients are dependent on the pH, and since intracellular space is usually more acidic than extracellular space and blood plasma, the intracellular fluoride concentrations are typically 10-50% lower.
Plasma protein binding of inorganic fluoride, and [18F]F-, is negligible. However, in blood or plasma samples, increased pH or [Ca2+] can increase [18F]F- binding to albumin substantially, which also leads to reduced [18F-] in red blood cells (Carlson et al., 1960).
Applications
As a sensitive biomarker of calcium metabolism and bone reconstruction, [18F]F- has indications in metabolic and inflammatory bone diseases such as osteomyelitis, osteoarthritis, spondyloarthropathies, avascular osteonecrosis, and Paget's disease; orthopedic disorders, such as heterotopic ossification, painful prosthetic joints, trauma and overuse injuries, stress fractures, insufficiency fractures, spondylolysis and spondylolisthesis, enthesopathies, and viability of bone grafts; and bone metastasis and primary bone malignancies (Strobel & Vali, 2012; Beheshti et al., 2015; Raynor et al., 2016; Kwee et al., 2017; Beheshti, 2018; Botman et al., 2019; de Jongh et al., 2023). However, since [18F]F- has high affinity on hydroxyapatite whether there is new bone being formed or not, [18F]fluoride PET does not allow conclusions about bone healing activity in shaft fractures with necrotic fragments, bone ingrowth into bone allografts, or bone remodelling around calcium phosphate coated prosthesis (Bernhardsson et al (2018)).
The use of [18F]F- in oncological applications has been studied comprehensively. [18F]NaF is not tumour specific, as healthy and healing bone can also exhibit increased [18F]F- uptake (Bastawrous et al., 2014; Rohren & Macapinlac, 2017; Weisman et al., 2019). Arthropathic diseases are common in elderly subjects, and therefore the most common causes of increased [18F]F- bone uptake. Bone metastases occur in red bone marrow, and can be detected with [18F]FDG PET (Blebea et al., 2007; Behzadi et al., 2018; Høilund-Carlsen et al., 2018). [18F]NaF and bone scintigraphy can detect bone metastases only after appearance of structural changes in the osseous bone substance (Høilund-Carlsen & Alavi, 2019). Dynamic [18F]fluoride PET/CT is promising in differentiating benign from malignant bone lesions (Beheshti, 2018). However, in multiple myeloma patients, [18F]NaF cannot differentiate malignant from benign degenerative and traumatic lesions (Sachpekidis et al., 2017a), and does not perform better than FDG PET in treatment response evaluation (Sachpekidis et al., 2017b). Machine learning approach, utilizing CT image in addition to static PET scan, can provide better classification of benign and malignant bone lesions (Perk et al., 2018). [18F]fluoride PET/CT could be used to select patients for 223Ra-therapy (Letellier et al., 2018). The [18F]fluoride and [18F]FDG uptakes in osseous metastases are spatially dislocated, and correlation is dependent on the estimated parameter and the time of the scan in respect to the treatment (Simoncic et al., 2019). Total lesion metabolism and heterogeneity parameters may improve response assessment with [18F]fluoride (Azad et al., 2019).
Ectopic calcification of soft tissue occurs in many diseases, including atherosclerosis and chronic kidney disease, as tissue fibroblasts convert to osteogenic cell types that generate hydroapatite chrystals in the extracellular matrix (ECM). Since soft tissue calcification process is similar to the bone formation, it can be assessed using [18F]fluoride PET (Scherer & Psaltis, 2016). Physiologic intracranial calcification increases by age, and increased [18F]F- uptake and Hounsfield unit have been shown to correlate with age in choroid plexus and epithalamus (Al-Zaghal et al., 2019). [18F]fluoride PET may be useful in quantification of protein deposits in cardiac amyloidosis (Morgenstern et al., 2018; Abulizi et al., 2021). Calcified renal stones can have high [18F]fluoride uptake.
Renal [18F]F- clearance can be used as an index of GFR (Schnöckel et al., 2008).
Input function for [18F]F- analysis
Arterial plasma radioactivity curve is the gold standard input function. Several methods have been proposed for reducing the burden of blood sampling in clinical studies, especially when Patlak plot or FUR are used to analyze the data, as reviewed by Doot (2019).
Blood and blood plasma
[18F]F- concentration in arterial plasma is traditionally considered as the gold standard input function. [18F]F- is in equilibrium between plasma and blood cells, and therefore blood TAC should be used as input function instead of plasma TAC. Erythrocyte-to-plasma ratio is ∼0.43, and stable for at least 2 hours (Park-Holohan et al., 2001). Thus, results obtained using plasma and blood input should correlate perfectly, but since the blood TAC is lower than plasma TAC, using plasma TAC as input function instead of plasma will lead to lower uptake rate estimates.
Blood pH affects the distribution of [18F]F- between plasma and erythrocytes, with lower pH leading to reduced concentration in the red blood cells (Carlson et al., 1960).
Image-derived input function
Arterial blood curve can be retrieved noninvasively from dynamic PET image (Cook et al., 1999; Puri et al., 2011a and 2011b; Simoncic et al., 2019; Haddock et al., 2019). In rats, the [18F]F- concentration in heart muscle is less than half of the concentration in the plasma (Carlson et al., 1960); therefore, blood TAC can be derived from the heart cavity without spill-over from the myocardial muscle, although the blood TAC may then be somewhat underestimated.
If needed, the blood TAC can then be converted to plasma TAC using the linear function for plasma-to-blood ratio
provided by Hawkins et al (1992); however, this is based on arterialized venous, followed by venous blood sampling. Schiepers et al (1997) reported a stable plasma-to-blood ratio 1.30±0.09, which simplifies the conversion. The plasma-to-blood ratio measured by Cook et al (1999) was 1.4. Red blood cell-to-plasma ratio was 0.433±0.006 (Park-Holohan et al, 2001). In porcine study the plasma-to-blood ratio was 1.15-1.32 (Piert et al., 2001). In rats, red blood cell-to-plasma ratio was 0.54±0.02 (Wallace-Durbin, 1954).
Arterial and venous blood
Venous plasma concentrations of [18F]F- reach the same level as the concentrations in arterial plasma 12 min after injection (Hirata et al., 2005), or at least 40 min after injection (Cook et al., 1999 and 2000).
Population-based input function
A semipopulation based input function method, requiring only few venous samples, has been developed for analysis of dynamic and static [18F]F- PET studies (Cook et al., 2000; Blake et al., 2012 and 2014; Siddique et al., 2012 and 2014; Azad et al., 2019).
Quantification of [18F]F- bone scans
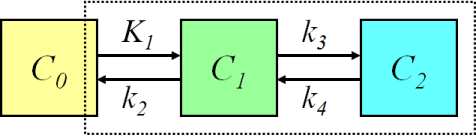
Figure 1. The bone kinetics of [18F]NaF can be described with two-tissue compartment model. The model parameter K1 represents the unidirectional clearance of [18F]F- from blood to the extravascular compartment, and it is usually considered to be mainly determined by blood flow. Parameter k2 represents reverse transport into blood, and k3 and k4 represent the incorporation and release rates of [18F]F- in the bone apatite compartment. The influx rate Ki = K1×k3/(k2 + k3) represents both bone blood flow and fluoride incorporation fraction. Ki/K1, or k3/(k2 + k3) represents the bone incorporation fraction of fluoride in the extracellular space. The net efflux of fluoride from bone mineral can be calculated as (k4 × k2)/(k2 + k3).
The first-pass extraction of 18F- is close to 1 in healthy bone in rabbits, but there may be slight differences between bone types (Costeas et al., 1970; Wootton & Doré, 1986).
Fluoride transport (K1) and flux (Ki) can be accurately and independently estimated for bone and bone metastases with compartmental model in Figure 1 (Hawkins et al., 1992; Cook et al., 2000; Frost et al., 2003; Doot et al., 2010). Assuming k4=0 in the compartmental model reduces further the CV and confidence intervals (Frost et al., 2008), and is a reasonable assumption if scan length is limited to 30 min (Peters et al., 2015). Setting k4=0 was also favoured by Akaike and Schwarz criteria (Termmerman et al., 2013). Due to the high variance of the parameters k2-k4, the bone incorporation fraction of fluoride, k3/(k2 + k3), may be a more useful parameter than the individual rate constants (Piert et al., 2003; Haddock et al., 2019). Blood volume (VB) is usually fitted as one of the model parameters, although the estimated value does not actually represent blood volume but rather 18F- extraction, including it in the model only marginally improves the quality of the fit, and the high variability of the term prevents its use as clinical parameter (Hawkins et al., 1992).
The recommended analysis method for quantification of fluoride bone metabolism is Patlak analysis based on its simplicity and reliability even in areas with low metabolic activity (Brenner et al., 2004a and 2004b; Puri et al., 2012). Precision and intraclass correlation for results of Patlak analysis (Ki) are comparable to compartmental model fitting and biochemical markers (Frost et al. 2008; Raijmakers et al., 2014). Linear portion of the Patlak plot is reached at about 10-15 min after [18F]F- administration, therefore the total study length can be less than one hour. However, the requirement of irreversible uptake in Patlak analysis is not met with [18F]F-, causing slight downward curvature in Patlak plots, and about 20-25% underestimation of Patlak-Ki when compared to Ki estimated using compartmental model fitting (Wen et al., 2009; Puri et al., 2012; Blake et al., 2014; Siddique et al., 2014). The efflux rate (kloss) can be introduced as a parameter in the Patlak plot (Blake et al., 2014), or a fixed population-based value can be used (Siddique et al., 2014).
Patlak analysis can be easily performed pixel-by-pixel to produce Ki images. Parametric Ki images can also be computed applying multilinear model fitting (Sanchez-Crespo et al., 2017). Also reversible two-tissue compartmental model for [18F]F- can be linearized, and NNLS method can be used to compute good-quality parametric image of Ki (Kim et al., 2007).
Whole-body [18F]fluoride PET without blood sampling can provide images for qualitative analysis (Hoh et al., 1993), and SUV calculation. If arterial or venous input function is available, then Ki image can be computed from the whole-body late-scan image, if intercept of the Patlak plot is assumed to be known, or, in practise, set to a population average (Siddique et al., 2012).
Perfusion
Compartmental model parameter K1 in bone [18F]NaF studies is usually assumed to represent perfusion (Nahmias et al., 1986; Schiepers et al., 1998; Cook et al., 2000; Frost et al., 2009). Precise estimation of K1 may require delay correction, and delay time can be fitted with the compartmental model parameters (Simoncic et al., 2019).
K1 in bone has been shown to correlate weakly with perfusion, measured with [15O]H2O-PET (Piert et al., 2002; Raijmakers et al., 2014). Reliable perfusion estimates can be obtained if correction for permeability-surface area product (PS) is applied (Piert et al., 1998 and 2002). Based on this, for example, Haddock et al (2019a) have used PS=0.24 to convert K1 into perfusion from equation
Bone loading exercise increases the bone perfusion and total fluoride uptake (Haddock et al., 2019b).
SUV
Semiquantitative SUV can be measured from static PET scans without blood sampling, and static images can be easily converted into SUV images. SUV is affected by F- plasma clearance, and can therefore not be used if individual differences in renal function are possible.
In bone studies, Ki correlated well with SUV (Brenner et al., 2004a and 2004b; Frost et al., 2008) and SUVLBM, calculated from data collected 50-60 min after tracer injection (Raijmakers et al., 2014). In rheumatoid arthritis the [18F]F- SUV in joints correlates with disease activity (Watanabe et al., 2016). In low-uptake areas, such as limb bones, the test-retest variability is increased. Disease or treatment related changes in F- uptake need to be >50% to be detected reliably by SUV, while >25% difference can be detected using Ki (Apostolova & Brenner, 2010). Patlak plot performs better than SUV for instance in treatment response assessment (Azad et al., 2019).
Skeletal sites have different normal SUVs. Win & Aparici (2014) and Sabbah et al. (2015) have reported the SUVs in the normal skeleton, benign and malignant bone lesions, and extraskeletal tissues.
Quantification of arterial wall [18F]F- uptake
[18F]F- has been used in the assessment of vascular calcification processes that are ongoing in atherosclerosis. Vessel [18F]F- uptake is increased especially in the early stages of plaque formation when calcium deposition is progressing, but less so in the end-stage of plaque formation (Fiz et al., 2015; Quirce et al., 2016).
Quantification is difficult because of the small target size and relatively high [18F]F- concentration in the blood. In assessment of abdominal aorta calcification the vertebral [18F]F- uptake must be accounted for (Debono et al., 2022). Arterial wall [18F]F- uptake has usually been quantified by dividing or subtracting the ROI maximum voxel value with the concentration in the blood (Blomberg et al., 2015; Fletcher et al., 2022). Maximum voxel value is affected by the image resolution and reconstruction parameters. Target-to-blood ratio increases with injection-to-scan time (Kwiecinski et al., 2019), and Lassen et al (2019) proposed harmonizing the ratio to a 60-min reference time by accounting for the decrease in blood activity.
Calculation of Ki maps in TPC
Images of metabolic rate of [18F]F- in Turku PET Centre can be computed:
1. Get plasma TAC data
Extract plasma TAC data (for example ck29vp.kbq)
from PETO or PETPACS, saving it in local data folder (for example C:\work),
if manual blood sampling was conducted.
In case of image-derived input, you may also need to convert the blood TAC to plasma TAC.
Blood TAC could be used as input function without conversion to plasma, but it must be noted that results obtained with blood input are not directly comparable to results obtained with plasma input.
2. Get dynamic PET image
Extract dynamic PET image data
(for example *dicom.zip) from PETO or PETPACS, and uncompress PET image folder
(for example *_3D_OSEM) into your local data folder.
For anatomical reference, you can extract and uncompress also CT or MR image folders, although those are not needed in Ki image calculation.
Note: if you do not have space on your C: drive you can keep your data in S: drive, but local folder (in C: drive) is much faster; just remember to copy final results to your groups S: disk folder for archiving and delete the files on C: disk to save local disk space.
3. Compute the Ki image
Open command-prompt window, change to working folder
(for example C:\work), create folder for Ki DICOM image and enter
the following command, replacing file names and paths as necessary. But be sure to enter DICOM
folder name with trailing \* with quotation marks around it, and as name for
Ki image enter the name of an existing but empty folder with
prefix for DICOM file names:
cd c:\work
mkdir ck29ki
imgki_2_0_3 ck29vp.kbq "ck29_DOE_JOE_PT_20090617_TPC_3D_OSEM\*" 15 ck29ki\ck29ki
"2_0_3" is the .NET software version, which you can replace to the latest available version.
"15" is the start time of linear fit; although 10 min is reported as a suitable start time, 15 min may be more safe setting because image may contain bone and other tissues of interest with markedly slower rates of metabolism.
If file names contain scandic characters (ä, ö, å), you may need to first change the active console code page:
chcp 1252
These instructions apply to image data in DICOM format, with the advantage of preserving the image header information, enabling easy alignment between CT and parametric Ki image.
The resulting Ki image can then be read in Carimas™ together with corresponding anatomical reference image (CT or MR). ROIs can be drawn, and the ROI mean value equals the regional influx rate (Ki) of F- directly.
Also ECAT 7, NIfTI, and Analyze format images can be used in Ki image computation, using C version of imgki. Then the full image file names are given instead of DICOM folders.
Instead of executing one study at a time, the Ki image calculation can be done in batch mode, even without using command-prompt window at all.
See also:
Literature
Apostolova I, Brenner W. Measuring bone metabolism with fluoride PET: methodological considerations. PET Clin. 2010; 5: 247-257. doi: 10.1016/j.cpet.2010.02.008.
Bastawrous S, Bhargava P, Behnia F, Djang DSW, Haseley DR. Newer PET application with an old tracer: role of 18F-NaF skeletal PET/CT in oncological practice. RadioGraphics 2014; 34: 1295-1326. doi: 10.1148/rg.345130061.
Beheshti M, Mottaghy FM, Payche F, Behrendt FF, Van den Wyngaert T, Fogelman I, Strobel K, Celli M, Fanti S, Giammarile F, Krause B, Langsteger W. 18F-NaF PET/CT: EANM procedure guidelines for bone imaging. Eur J Nucl Med Mol Imaging 2015; 42(11): 1767-1777. doi: 10.1007/s00259-015-3138-y.
Blake GM, Puri T, Siddique M, Frost ML, Moore AEB, Fogelman I. Site specific measurement of bone formation using [18F] sodium fluoride PET/CT. Quant Imaging Med Surg. 2018; 8(1): 47-59. doi: 10.21037/qims.2018.01.02.
Blau M, Nagler W, Bender MA. Fluorine-18: a new isotope for bone scanning. J Nucl Med. 1962; 3: 332-334. PMID: 13869926.
Buzalaf CP, De Lima Leite A, Buzalaf MAR. Fluoride Metabolism. In: Fluorine: Chemistry, Analysis, Function and Effects. Royal Society of Chemistry, 2015. doi: 10.1039/9781782628507-00054.
Czernin J, Satyamurthy N, Schiepers C. Molecular mechanisms of bone 18F-NaF deposition. J Nucl Med. 2010; 51: 1826-1829. doi: 10.2967/jnumed.110.077933.
Even-Sapir E. 18F-fluoride PET/computed tomography imaging. PET Clin. 2014; 9: 277-285. doi: 10.1016/j.cpet.2014.03.003.
Gjedde A. Imaging bones of contention. Acta Orthop Scand. 2003; 74(6): 631-632. doi: 10.1080/00016470310018117.
Grant FD, Fahey FH, Packard AB, Davis RT, Alavi A, Treves ST. Skeletal PET with 18F-fluoride: applying new technology to an old tracer. J Nucl Med. 2008; 49(1):68-78. doi: 10.2967/jnumed.106.037200.
Haddock B, Fan AP, Jørgensen NR, Suetta C, Gold GE, Kogan F. Kinetic [18F]-fluoride of the knee in normal volunteers. Clin Nucl Med. 2019; 44(5): 377-385. doi: 10.1097/RLU.0000000000002533.
Hawkins RA, Choi Y, Huang SC, Hoh CK, Dahlbom M, Schiepers C, Satyamurthy N, Barrio JR, Phelps ME. Evaluation of the skeletal kinetics of fluorine-18-fluoride ion with PET. J Nucl Med. 1992; 33(5): 633-642. PMID: 1569473.
Kairemo K, Macapinlac HA (eds.): Sodium Fluoride PET/CT in Clinical Use. Springer Cham, 2019. doi: 10.1007/978-3-030-23577-2.
McCarthy I. The physiology of bone blood flow: a review. J Bone Joint Surg. 2006; 88-A (Suppl 3): 4-9. doi: 10.2106/JBJS.F.00890.
Muhonen A, Muhonen J, Minn H, Kulmala J, Klossner J, Teräs M, Knuuti J, Happonen RP. The effects of irradiation and hyperbaric oxygen on bone formation during rabbit mandibular distraction. Arch Oral Biol. 2002; 47(10): 701-707. doi: 10.1016/S0003-9969(02)00051-1.
Muhonen A, Peltomäki T, Knuuti J, Raitakari O, Happonen RP. Osteoblastic activity of the rabbit temporomandibular joint during distraction osteogenesis assessed by [18F]fluoride positron emission tomography. Eur J Oral Sci. 2002; 110(2): 144-148. doi: 10.1034/j.1600-0722.2002.11208.x.
Raijmakers P, Temmerman OPP, Saridin CP, Heyligers IC, Becking AG, van Lingen A, Lammertsma AA. Quantification of 18F-fluoride kinetics: evaluation of simplified methods. J Nucl Med. 2014; 55: 1122-1127. doi: 10.2967/jnumed.113.135269.
Saridin CP, Raijmakers PGHM, Kloet RW, Tuinzing DB, Becking AG, Lammertsma AA. No signs of metabolic hyperactivity in patients with unilateral condylar hyperactivity: An in vivo positron emission tomography study. J Oral Maxillofac Surg. 2009; 67: 576-581. doi: 10.1016/j.joms.2008.09.021.
Siddique M, Frost ML, Blake GM, Moore AEB, Al-Beyatti Y, Marsden PK, Schleyer PJ, Fogelman I. The precision and sensitivity of 18F-fluoride PET for measuring regional bone metabolism: a comparison of quantification methods. J Nucl Med. 2011; 52: 1748-1755. doi: 10.2967/jnumed.111.093195.
Whitford GM, Pashley DH, Stringer GI. Fluoride renal clearance: a pH-dependent event. Am J Physiol. 1976; 230(2): 527-532. doi: 10.1152/ajplegacy.1976.230.2.527.
Whitford GM, Pashley DH, Reynolds KE. Fluoride tissue distribution: short-term kinetics. Am J Physiol. 1979; 236(2): F141-F148. doi: 10.1152/ajprenal.1979.236.2.F141.
Wong KK, Piert M. Dynamic bone imaging with 99mTc-labeled diphosphonates and 18F-NaF: mechanisms and applications. J Nucl Med. 2013; 54: 590-599. doi: 10.2967/jnumed.112.114298.
Tags: Fluoride, Bone, Atherosclerosis, pH
Updated at: 2023-06-14
Created at: 2008-04-30
Written by: Vesa Oikonen