Analysis of [13N]ammonia PET studies
Under physiological conditions (pH 7.2), ~99% of [13N]ammonia exists in ammonium ion form [13N]NH4+, which can only slowly penetrate cell membranes, possibly via K+ transporter, but the non-ionic form, [13N]NH3, diffuses rapidly into cells. Intracellular [13N]ammonia can be metabolically trapped in glutamine, glutamate, and carbamyl phosphate. [13N]ammonia could be used to assess in vivo these enzymatic reactions where nitrogen is exchanged among metabolites (Cooper, 2011), especially in brain and tumours. [13N]ammonia has been widely used to measure perfusion, especially in myocardium, but also in kidneys and liver.
[13N]Ammonia is excreted by the kidneys.
Myocardial perfusion measurement
First-pass myocardial extraction of [13N]ammonia ([13N]NH3) is very high, close to one, when perfusion (blood flow) is normal or lower than normal, and even for flow values up to 5 ml/(min×100 g) over 90% (Schelbert et al., 1981). Following the initial extraction across the capillary membranes and via passive diffusion as [13N]NH3 or via active transport as ammonium ion, [13N]NH4+, into the muscle cells, [13N]ammonia is either incorporated into the amino acid pool as [13N]glutamine, catalyzed by glutamine synthetase, or it diffuses back into the blood. The myocardial metabolic retention is an adenosine triphosphate -dependent process, which may become a rate-limiting step in uptake at high perfusion levels. Thus uptake and retention can both be altered by changes in the metabolic state of the myocardium (Bergmann et al., 1980; Schelbert et al., 1981; Machac et al., 2006). Therefore [13N]NH3 is not an optimal tracer for studying perfusion or microvascular function in ischemic and hibernating heart, despite of its clear usefulness in clinical practice.
Analysis methods used in literature
The calculation models should include corrections for the partial volume effect and spillover from the LV cavity onto the ventricular myocardium. Methods may also account for the dependency of myocardial extraction on blood flow.
Myocardial perfusion reserve may be estimated from simple stress/rest myocardial activity ratio 2-6 min post injection (Juneau et al., 2021).
Different software packages have demonstrated poor agreement in myocardial stress perfusion and perfusion reserve, and the discrepancies are dependent on the region (Monroy-Gonzalez et al., 2019).
Arterial blood input
Arterial blood curve is the input function to the analysis models, and the LV TAC from PET image can directly represent that in case of adult humans and modern PET scanners (Weinberg et al., 1988). Using left atrial input function instead of left ventricular input function may provide better compartment model fits and higher MBF values because of lower spillover from myocardium (Hove et al., 2004).
Over 90% of the blood radioactivity within the first two minutes is present as [13N]ammonia, but at 3-5 min the recirculating 13N carrying metabolites, mainly [13N]glutamine and [13N]urea, represent about half of the blood radioactivity (Rosenspire et al., 1990; Müller et al., 1994). Yet, the effect of labelled metabolites in blood on MBF measurements is relatively small, especially to the compartment model parameter representing blood flow, and correction for metabolic contamination may not be necessary (Hutchins et al., 1990; Muzik et al., 1993), and is generally not applied if only the first 2 minutes are used in the model fitting. The total scan length has indeed been shortened to reduce the effect of blood metabolites (DeGrado et al., 1996).
Arterial blood data can be corrected for the metabolites by measuring individually the fractions of parent [13N]ammonia from blood samples during the study (Müller et al., 1994). The average fraction curves published by Rosenspire et al., (1990) or Müller et al. (1994) have been commonly used to make an approximate metabolite correction (van den Hoff et al., 2001; Lortie et al., 2007; Choi et al., 1999).
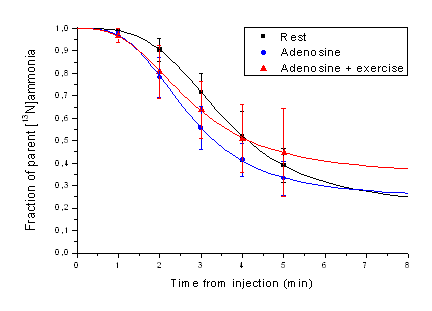
Figure 1. Symbols represent the measured averaged (n=11) fractions of parent tracer in blood as published by Müller et al. (1994). Lines represent "Hill-type" function fits to the data.
van den Hoff et al. (2001) presented a formula for metabolite correction based on fractions measured by Rosenspire et al., (1990).
Compartment models
A two-tissue compartment model (Hutchins et al., 1990; Muzik et al., 1993; Sawada et al., 1995) has been widely used to estimate MBF with [13N]ammonia. The first tissue compartment represents interstitial and intracellular [13N]ammonia, and the second tissue compartment represents the intracellular metabolic products of [13N]ammonia. Intracellular metabolism is assumed to be irreversible process during the PET scan (k4=0). Four model parameters are fitted, K1, k2, k3, and tissue blood volume. A generalized linear least squares (GLLS) method has also been proposed to generate parametric blood flow (K1) images, accounting for bidirectional spillover effects, but not for partial volume effect (Chen et al., 1998).
Partial volume and spill-over effects were incorporated in the two-tissue compartment model through the parameter for tissue blood volume, assuming a "geometrical_model">geometrical model (Hutchins et al., 1990; Hutchins et al., 1992; Nitzsche et al., 1996); this may be considered appropriate when myocardial ROIs are placed so that they contain only myocardial tissue and blood pool (DeGrado et al., 2000; Choi et al., 1999), that is, are not drawn close to the outer edge of heart muscle. Alternatively, these effects can be corrected based on measured myocardium wall thickness and scanner resolution (Krivokapich et al., 1989). Spillover effects could also be corrected with the help of factor analysis (Wu et al., 1995).
Parameters k3 and k2 can be constrained based on K1, so that only two parameters are fitted (K1 and tissue blood volume). In this case fit time is usually reduced to 2 minutes after injection (Krivokapich et al., 1989; Nitzsche et al., 1996; Choi et al., 1999). Smaller number of fitted parameters leads to lower SD of blood flow estimates, and shorter scan period minimizes subject motion artefacts, at the cost of introducing additional assumptions. A modification of these assumptions was suggested by Hickey et al. (2005) to achieve higher perfusion estimates, closer to estimates from [15O]H2O PET.
One-tissue compartment model (k3=0) was already suggested by Hutchins et al. (1990), but DeGrado et al. (1996) shortened the fit time from 10 to 4 minutes; during that time the metabolically trapped tracer was not kinetically distinguished. This method minimizes the effects of radioactive metabolites in the blood (DeGrado et al., 1996). For septum, two-tissue compartment model was shown to be superior to one-tissue compartment model, even with short fit time and when RV spillover was taken into account (Hove et al., 2003).
Graphical analysis (Patlak plot)
Choi et al. (1993) suggested using graphical analysis for irreversible tracers ("Patlak plot") to estimate the blood flow using the PET data from 70 to 165 s (or 70 -120 s in dogs) after injection. They developed, based on dog studies, an equation to convert the Ki from Patlak analysis to MBF, but this correction may not be applicable in real patient studies (Chen et al. 1998). To produce parametric flow images with acceptable noise level the intercepts of the plots had to be constrained to physiological range (Choi et al., 1993). Patlak analysis does not include any correction for recovery effects; therefore Choi et al. (1993) had to apply recovery corrections to the data before Patlak analysis. Spillover affects the y axis intercept of the Patlak plot, but not the Ki. Several aspects of the study, including the strong time-dependency, were strongly criticized by Mullani (1993). In a method comparison study Patlak method was found to be the best of the tested non-compartmental methods (Choi et al., 1999). However, if quantitative perfusion values are needed, then usage of other (fast) methods for analysis of [13N]ammonia data is recommended.
Retention model
Bellina et al. (1990) suggested a method based on calculation of retention index (FUR, tissue activity divided by integral of input curve). Retention is simple to calculate, but retention factor (not extraction factor, which is always close to one with [13N]ammonia) is severely decreased with increasing flow and impacted by changes in metabolic state of the myocardium, more so than the blood flow estimate from compartment model.
Simulations
Glatting and Reske (1999) have studied using simulations the effect of including the correction for physical decay into the model equations. They found no effect in the mean quantitative values.
Chen et al. (1998) used simulations to validate a GLLS method for generation of parametric flow images.
Golish et al. (2001) simulated data to validate a nonlinear method for producing parametric images.
Suggested analysis method
Our current suggestion is to apply either two-tissue compartment model (K1, k2, k3) or one-tissue compartmental model, with geometrical model correction for spillover and partial volume effects. These methods are implemented in Carimas™ (Nesterov et al., 2022).
To calculate quantitative perfusion values, a nonlinear extraction correction may be needed. Parameters for the correction functions may need to be determined for each institute, unless the study protocols are similar. Carimas implements several extraction correction methods.
With suggested model, and with short fit time, the influence of blood metabolite correction is negligible on the MBF estimates (Muzik et al., 1993). If metabolite correction is required, then we suggest that it is based on average fraction curves measured in rest, adenosine, or adenosine-plus-exercise studies (Müller et al., 1994) and fitted with Hill-type function (Fig. 1).
Renal perfusion measurement
Bolus infusion technique has been used to measure renal perfusion (RBF) with PET using [13N]NH4+. Extraction rate becomes limiting factor at high blood flow, but good perfusion maps for diagnostic purpose can be obtained. Ammonia in the blood is excreted by the kidneys, but it does affect the perfusion values that are derived from the unidirectional uptake rate.
Chen et al (1992) validated RBF method in dogs against microsphere method. Mean cortical RBF in dogs was 4.0 mL/(min*g). Scan time was 20 min but only ≤2 min was used in analysis. Input curve was derived from ROI drawn on abdominal aorta, and corrected for PVE and metabolites. Renal TACs were corrected for recovery coefficient. Irreversible two-tissue compartmental model data was fitted to the data. Adding vascular component to the model increased variance in RBF estimates (Chen et al., 1992). This method has been used in rat studies in a myocardial infarction model (Juárez-Orozco et al., 2015). In later rat [13N]NH4+ studies only the first 2 min has been used in the analysis to minimize the effect of circulating metabolites (Ismail et al., 2016 and 2017). With long axial field of view PET systems the RBF can be quantified from data acquired during routine clinical myocardial perfusion PET/CT (Brown et al., 2023).
Nitzsche et al (1993) simplified the analysis further by using Patlak plot to estimate RBF, and validated the method in pigs, comparing Patlak method against the compartmental model. Patlak method was used to compute RBF images. Killion et al (1993) validated the method in pigs against microsphere method. Additionally, method was validated against RBF measured using [15O]H2O in healthy human subjects (Nitzsche et al., 1993).
Brain studies with [13N]ammonia
Injected [13N]ammonia is very quickly converted into [13N]glutamine in the brain (Cooper et al., 1979), with little [13N]glutamate (Okada et al., 2009).
The initial phase of [13N]ammonia uptake has been proposed to be useful for perfusion measurement also in the brain (Phelps et al., 1976, 1977 and 1981; Egerton et al., 2020), although pH and integrity of the BBB will affect the uptake (Raichle and Larson, 1981). Reversible one-tissue compartmental model is the preferred model for [13N]ammonia brain PET, and provides K1 estimates that correlate well with cerebral blood flow assessed using radiowater (Egerton et al., 2020).
Late-phase imaging (5-15 min after [13N]ammonia injection in rats) may be suitable for assessment of glutamine synthetase activity (Momosaki et al., 2015). However, Egerton et al (2020) could not estimate k3 reliably from 30-min brain PET scans.
Cancer studies with [13N]ammonia
L-Glutamine is synthesized by glutamine synthetase (GS) from L-glutamate and ammonia. GS overexpression in certain tumour cells enable the use of [13N]ammonia in cancer imaging (Shi et al., 2014), for instance in prostate cancer (Shi et al., 2014), and glioma (He et al., 2016).
See also:
- MBF using [18F]Flurpiridaz
- MBF using [15O]H2O
- MBF using 82Rb
- Partial volume and spillover effects in cardiac PET
- Glutamine
- Aquaporins
Tags: Perfusion, Glutamine, Myocardium, Kidney, Brain, Carimas, MBF
Updated at: 2023-09-28
Created at: 2007-11-21
Written by: Vesa Oikonen, Chunlei Han