IDIF from abdominal aorta in [15O]H2O PET
Arterial blood time-activity curve (TAC) can be measured from the abdominal aorta in the dynamic PET image. In human adults the diameter of abdominal aorta is large in comparison to resolution of modern PET scanners, enabling the input function to be directly measured from a ROI drawn on the middle of abdominal aorta, without marked bias caused by PVE. With earlier generations of PET scanners the image resolution was lower, and the abdominal aorta curve had to be corrected. These methods are still required in small-animal PET studies.
Germano et al (1992) developed an IDIF method where blood TAC is extracted from dynamic PET image based on threshold and correction with recovery coefficient. Recovery coefficient is calculated from the FWHM in the middle of the image and diameter of abdominal aorta. Method was validated for [13N]ammonia studies.
This algorithm has been implemented in TPC in program eabaort, and the method was validated with [15O]H2O PET studies (Liukko et al., 2007). It is recommended that FWHM is given to the program, because then program can estimate the vessel diameter from image. For example:
eabaort -FWHM=6.3 -diameters=best s6678dy1.img s6678ab.dat
|
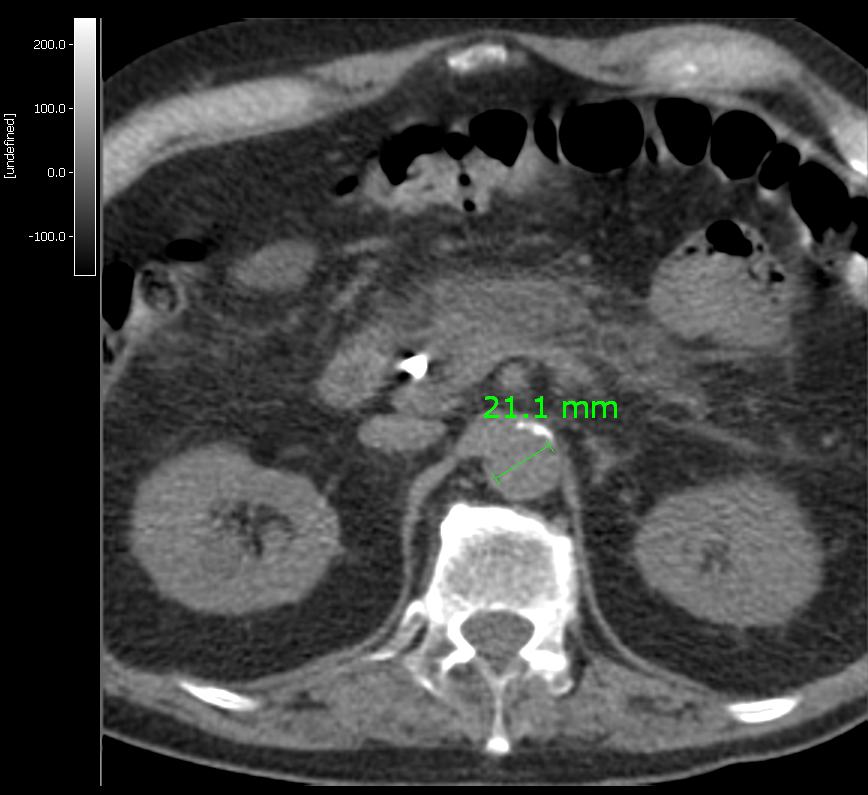
Alternatively, if inner diameter of aorta can be measured from CT or MR image, it can be given to eabaort. Carimas can be used to measure the diameter inside the artery wall. |
|
The user must first find the image planes which contain a clear view of the abdominal aorta that has not yet split into two vessels, and does not contain any other high spots. Mask the other hot spots with Carimas, if necessary, or crop the image (planes) before using this eabaort.
Output file (.dat) contains the extracted blood curve, which is calibrated and corrected for decay. NOTE! Avoid naming the output file with extension .bld, .lis or .alg. These are reserved for uncorrected ABSS blood files.
Usage in calculation of perfusion image
The resulting blood TAC is automatically corrected for physical decay and mostly for dispersion, because it is retrieved from the same image as the target tissue. Time delay correction may be still needed. After that the blood curve can be used without further corrections to calculate perfusion image.
Literature
Liukko K, Oikonen V, Tolvanen T, Virtanen K, Viljanen A, Sipilä H, Nuutila P, Iozzo P. Non-Invasive Estimation of Subcutaneous and Visceral Adipose Tissue Blood Flow by Using [15-O]H2O PET with Image Derived Input Functions. Open Med Img J. 2007; 1: 7-13. doi: 10.2174/1874347100701010007.
Germano G, Chen BC, Huang S-C, Gambhir SS, Hoffman EJ, Phelps ME. Use of abdominal aorta for arterial input function determination in hepatic and renal PET studies. J Nucl Med. 1992; 33: 613-620. PMID: 1552350.
Scremin OU, Cuevas-Trisan RL, Scremin E, Brown CV, Mandelkern MA. Functional electrical stimulation effect on skeletal muscle blood flow measured with H215O positron emission tomography. Arch Phys Med Rehabil. 1998; 79: 641-646. doi: 10.1016/s0003-9993(98)90037-5.
Brix G, Belleman ME, Hauser H, Doll J. Recovery-koeffizienten zur quantifierung der arteriellen inputfunktion aus dynamischen PET-messungen: experimentelle und theoretische bestimmung. Nuklearmedizin 2002; 41: 184-190. PMID: 12224402.
Tags: Input function, IDIF, Blood, Image
Updated at: 2013-05-21
Written by: Vesa Oikonen