Attenuation correction
The two photons that are produced in the decay of positron emitting radionuclide must be detected during predetermined time window to be counted as a true coincidence event. Most of the photons are however lost because of their absorption in the body, depending on the size of the body in the field of view. This loss of detection of true coincidence events is called attenuation. It is lower in the body surface than deep in the body, low in lungs, and especially high in dense tissues such as bones, leading to severe artifacts in PET image, unless it is corrected during image reconstruction.
CT-based attenuation correction
PET image data scanned with PET-CT scanners is attenuation corrected using data from CT (computed tomography). Although CT-based attenuation correction is generally reliable, patient movement and remains of CT contrast media may cause quantitative errors and image artefacts. Respiratory movement causes differences in CT-based attenuation map and the actual attenuation during PET scan, which may cause bias (Chin et al., 2003).
MR-based attenuation correction
PET image data scanned with PET-MR scanners is attenuation corrected using data from MR; MR data cannot be directly used for attenuation correction, but attenuation map must be estimated based on known attenuation factors of different tissue types (Hofmann et al., 2011). The necessary techniques have many caveats (Keller et al., 2013; Wagenknecht et al., 2013), but careful processing and standardization can produce reliable PET images (Teuho et al., 2016).
In imaging of the pelvic region, arms may need to be positioned up, to prevent errors due to arm truncation in MRI when high activity is present in the urinary bladder (Afshar-Oromieh et al., 2017). Iron overload in the liver can lead to low MRI intensity and underestimated attenuation (Büther et al., 2017).
In cardiac PET/MR, MR-based motion correction can include dynamic attenuation correction, reducing the risk of attenuation correction artefacts in regions at the lung-soft tissue boundary (Mayer et al., 2021).
Transmission scan
Traditionally the attenuation is measured by acquisition of a separate transmission scan when the patient is placed in the scanner but before the radiotracer injection. Transmission scan is performed using an external radioactive positron-emitting source (usually 68Ge/68Ga). Another scan with the same source has been performed earlier (usually each morning) without the patient (blank scan). Attenuation correction factors (≥1.0) are computed from the transmission and blank scan.
Attenuation correction for ECAT 931 in TPC
Attenuation correction must be done before or during
image reconstruction.
Attenuation correction files (*.atn) may be found in folder
S:\Research\archive\ecat-datnauhat\.
If not found anywhere, attenuation files can be recalculated from transmission sinogram (*tr?.scn),
blank scan (*bl1.scn), and normalization file (*.nrm). Correct blank scan and normalization file
must be selected based on the date of the transmission scan; the scan start date and time is found
in the main header of the sinogram file, for example with command:
egetstrt s04065tr2.scn
Attenuation correction file, and optionally the transmission image, can be computed in Windows, Linux, or macOS using program atnmake, for example:
atnmake 20oct99bl1.scn s04065tr2.scn 991005_norm.nrm s04065tr2.atn s04065tr2.img
This calculation may take a while, since it is using iterative MRP method. Note that this attenuation calculation method was used in TPC only in the last years of ECAT 931. Older attenuation files may be noisier, or very strongly filtered, and this will affect the quality of the reconstructed PET images. All images should be reconstructed and attenuation corrected using the same methods.

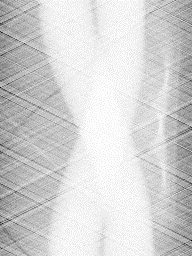
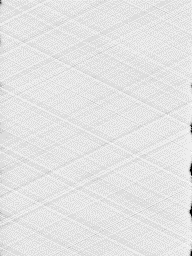
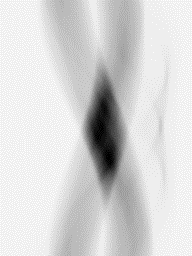
Figure 1a. Example of ECAT 931 data from a leg study: blank and transmission sinogram, normalization sinogram, and computed attenuation correction data. Plane #7.

Figure 1b. Example of transmission image, reconstructed from data shown in Figure 1a.
Literature
Bettinardi V, Alenius S, Numminen P, Teras M, Gilardi MC, Fazio F, Ruotsalainen U. Implementation and evaluation of an ordered subsets reconstruction algorithm for transmission PET studies using median root prior and inter-update median filtering. Eur J Nucl Med. 2003; 30(2): 222-231. doi: 10.1007/s00259-002-1046-4.
Carrio I, Ros P (eds.): PET/MRI - Methodology and Clinical Applications. Springer, 2014. doi: 10.1007/978-3-642-40692-8.
Christian PE, Waterstram-Rich KM (eds.): Nuclear Medicine and PET/CT - Technology and Techniques, 7th ed., Elsevier, 2012. ISBN; 978-0-323-07192-5.
Dahlbom M (ed.): Physics of PET and SPECT Imaging. CRC Press, 2017. ISBN 978-1-4665-6013-0.
Faasse T (2013). Positron Emission Tomography-Computed Tomography Data Acquisition and Image Management. In: Positron Emission Tomography - Recent Developments in Instrumentation, Research and Clinical Oncological Practice, Dr. Sandro Misciagna (Ed.), ISBN: 978-953-51-1213-6, InTech, DOI: 10.5772/57119.
Fahey FH. Data acquisition in PET imaging. J Nucl Med Technol. 2002; 30(2): 39-49. PMID: 12055275.
Teuho J, Johansson J, Linden J, Hansen AE, Holm S, Keller SH, Delso G, Veit-Haibach P, Magota K, Saunavaara V, Tolvanen T, Teräs M, Iida H. Effect of attenuation correction on regional quantification between PET/MR and PET/CT: a multicenter study using a 3-dimensional brain phantom. J Nucl Med. 2016; 57: 818-824. doi: 10.2967/jnumed.115.166165.
Teuho J. MR-based attenuation correction and scatter correction in neurological PET/MR imaging with 18F-FDG. Annales Universitatis Turkuensis, D1337, 2018.
Tags: Normalization, Attenuation, ECAT, PET
Updated at: 2021-12-23
Created at: 2016-11-03
Written by: Vesa Oikonen