Brain [15O]O2 PET
The cerebral metabolic rate for oxygen, CMRO2, blood flow, CBF, oxygen extraction fraction, OEF (i.e. oxygen extraction ratio, OER), and cerebral blood volume (CBV) are important indices in disease and health, because of the high metabolic rate and demand for oxygen in the brain. All of these can be regionally quantified using PET and 15O tracers (see review by Baron and Jones, 2012), while global OEF can be assessed by blood sampling alone (Hattori et al., 2004). Differences in magnetic susceptibility between oxy- and deoxy-haemoglobin can be utilized in BOLD MRI, and QSM MRI can even provide maps of baseline OEF (Kudo et al., 2016; Uwano et al., 2017). MRI after 17O-enriched O2 inhalation can provide CMRO2 images (Kurzhunov et al., 2017).
CMRO2, as determined using [15O]O2-PET, is similar in both sexes and does not change with age, although there are differences in the perfusion (Aanerud et al., 2017) and in synaptic density (Alonso-Nanclares et al., 2008).
Model for brain [15O]O2-PET

O2 is readily dissolved and diffused in lipid bilayers. The blood-to-brain permeability of O2 is even higher than that of water (Kassissia et al., 1995).
The metabolic rate of oxygen in the brain has been measured with steady-state and bolus inhalation techniques (Frackowiak et al., 1980; Depresseux et al., 1981; Herscovitch, 1995). Radiation dose to the patient is smaller in the single bolus inhalation than in the "gold standard" steady-state techniques, because separate [15O]H2O and [15O]CO studies are not necessarily needed. Single inhalation bolus study also require less scanner time. Techniques that require several PET scans may be unreliable if subject can move between the scans (Correia et al. 1985). Steady-state technique is still widely used, and it can be fully non-invasive, if [15O]H2O injection is replaced by [15O]CO2 inhalation. Steady-state technique is even applicable to mice studies, and because of the non-invasiveness, it can be repeated to the same animals in a follow-up study setting (Temma et al., 2017).
Bolus inhalation models are based on the study of Mintun et al (1984), in which perfusion and blood volume were still measured in separate PET studies using [15O]H2O and [15O]CO. In this two-compartmental model it is assumed that cerebral blood flow (CBF, f) delivers a certain amount of labelled oxygen into the blood volume in the tissue. A fraction of this oxygen (OEF, oxygen extraction fraction) is diffused to tissue and metabolized instantly to labeled water ([15O]H2O); the remaining fraction of delivered oxygen (1-OEF) is flushed from the tissue with blood flow. Labelled water is flushed away from the tissue with rate constant f/p, where p is the partition constant of the water. There is no marked back-flux of labelled oxygen from the brain tissue to blood (Iida et al., 2014). During the PET scan, labelled water is also formed elsewhere in the body, and it is delivered to the brain from arterial blood with perfusion f and washed away like the labelled water that is formed in the brain.

If the oxygen concentration in arterial blood, [O2]a, is measured, then the metabolic rate of oxygen (MRO2) can be calculated (Ter-Pogossian et al., 1970; Mintun et al., 1984) as:
Notice that equation for calculating [O2]a may be different in animals than in humans (Poulsen et al., 1997).
In healthy human subjects, OEF is ∼0.4, and relatively uniform in the brain, despite the 4-fold difference in perfusion of the grey and white matter (Raichle et al., 2001). Some regional OEF differences do exist: in the cerebellum OEF is 0.36±0.07, although its white matter fraction was lower than in most brain regions; pons consist mostly of white matter and OEF was only 0.28±0.08 (Ito et al., 2023). In the brain, perfusion is locally controlled in response to changed neuronal activity, with relatively low partial pressure of O2 at all times.
The differential equation describing the concentration changes in the tissue compartment, CT is simply:
, where CA(t)s are the arterial curves of [15O]O2 (marked with O) and [15O]H2O (marked with W).
The second-order Adams-Moulton solution of this first-order, constant-coefficient, ordinary differential equation (ODE) provides a formula that can be used to simulate the tissue time-activity curve:
A region of interest (ROI) or image voxel, measured with PET, contains blood in vascular volume VB. The regional time-activity curve in brain oxygen brain studies is thus a sum of tissue and blood curves:
, where the blood curve CB(t) is a mixture of [15O]O2 and [15O]H2O concentrations in arterial and venous blood (Holden et al. 1988). [15O]CO PET scan can provide the VB.
Quantification of OEF requires the measurement of perfusion with [15O]H2O, but MRO2, where f*OEF is used, can be estimated from a single inhalation [15O]O2 PET study (Holden et al. 1988). Also VB can be estimated from [15O]O2 inhalation study (Holden et al. 1988). It has been shown that in bolus and steady-state studies the [15O]CO scan can be omitted without introducing marked error in OEF or CMRO2 (Lammertsma and Jones, 1983; Kudomi et al., 2005; Sasakawa et al., 2011).
Ohta et al (1992) have further simplified the calculation model. Unlike in the previous models, in this method the separation of [15O]O2 and [15O]H2O in arterial blood is not necessary. When the duration of the study (time that is used in the model fit) is limited to 3 minutes, and the oxygen consumption is in the range 50-300 μmol/(min 100 g), the error caused by ignoring the recirculating radiowater will remain between ±10% (Ohta et al., 1992).
This model can be linearized (Blomqvist 1984; Ohta et al., 1992; Poulsen et al., 1997), which permits pixel-by-pixel computation to produce parametric cerebral MRO2 image.
This method has been used in TPC (Kaisti et al., 2003; Långsjö et al., 2005) and elsewhere (Aanerud et al., 2017; Blazey et al., 2018).
Performance of the model can be studied with simulations, for an example see the study by Duval et al (2002). Valabrègue et al., (2003) have developed a model where the assumption of insignificant [O2] in the brain tissue is relaxed; the model may not be applicable to analysis of PET data, but can still be useful in simulations.
Analysis of data from single-inhalation study
In single-inhalation model the parameter K1 in the one-tissue compartment model is assumed to represent f*OEF:
, thus, estimation of MRO2 requires simply estimating K1 from the PET data, and multiplying it with [O2]a.
Pre-processing of arterial blood curve
Arterial blood data from the on-line sampler needs to be processed before it can be used as input function in the calculation. Because blood TAC does not need to be corrected for [15O]H2O in the single-inhalation model, the blood data can be pre-processed using same procedure as the input function in [15O]H2O PET studies.
If you are working in TPC using computer with Windows XP, use the script water_input to process the on-line detector (blood pump) data prior to the analysis. It requires the countrate curve or similar data for the time delay correction; time delay correction is necessary in order to obtain non-biased oxygen consumption estimates (Poulsen et al., 1997).
Notice that in [15O]O2 PET studies the count rate curve has often been unusable, probably because of high random counts from dose collection system and/or exhaling of 15O gases; then we would advice to create "head curves" from dynamic PET images using imghead for all studies and use these instead of countrate curves.
The corrected blood TAC should always be plotted and controlled visually. Water_input script creates a plot of corrected input curve and count rate curve. Corrected blood curve often contains close-to-zero values in the end, which should be removed with a text editor, or left out when determining the fit time.
Compute K1
Make sure that PET data (dynamic image or regional TAC file) are in the same calibration units.
If dynamic PET image is very noisy, filtering dynamic PET image may be needed before proceeding. Modern image reconstruction methods are recommended over FBP to reduce the noise level (Ibaraki et al., 2009). Even after filtering, the noise-level in dynamic image may be too high to allow fitting vascular volume fraction (VB) as one of model parameters. If necessary, correct the PET data for the contribution of vascular radioactivity using a measured or population average based VB.
Calculation of K1 image
Compute the K1 image using imgflow with the following command-line arguments:
- option
-Va=noneto prevent an additional VB correction, if vascular volume was previously corrected - corrected arterial blood datafile (times in seconds)
- Dynamic [15O]O2 image file, preferably corrected for VB
- fit time in seconds (max 180 in this model)
- file name for the K1 image
The units in the [15O]O2 image are (mL blood)/(min * mL tissue) by default.
Calculation of K1 from regional TACs
Regional K1 can be estimated using fit_h2o with the following command-line arguments:
- Preferably, option
-Va=4to use pre-determined VB value (4% in the example) instead of estimating it as one model parameter - We recommend using option
-svg=filenameto save fitted TACs in SVG format for verifying the goodness-of-fit - Option
-mlto save results in units (ml blood)/(min * ml tissue) - Corrected arterial blood datafile
- Regional TAC file
- fit time in minutes (max 3.0 in this model)
- file name for the K1 results
Conversion of K1 values to MRO2
K1 is multiplied by the concentration of O2 in arterial blood. Program imgcalc can be used to process K1 image. Regional K1 result file can be read into a spreadsheet program and processed further there.
Turku PET Centre receives the arterial oxygen concentrations from the hospital laboratory in units ml O2/l blood, which have to be converted to ml O2/100 ml. The concentrations are normally about 20 ml O2/100 ml blood. If MRO2 is required in molar units, then [O2]a must be divided by the molar volume of an ideal gas, 22.4 ml/mmol; thereafter [O2]a values are about 0.9 mmol O2/100 ml blood.
After the multiplication, the unit of the MRO2 is either ml O2 / (min * 100 ml tissue) or mmol O2 / (min * 100 ml tissue), depending on the unit of [O2]a. If MRO2 is required per tissue mass instead of volume, the values can be divided by tissue density (specific gravity) of the brain, 1.04 g/ml (Reference Man).
Cerebral MRO2 in normal subjects are in the range of 2.2 to 3.5 ml O2 / (min * 100 g tissue) in gray matter (Perlmutter et al. 1987; Leenders et al. 1990). Division by 22.4 ml/mmol gives range 0.10 - 0.16 mmol O2 / (min * 100 g tissue).
Example of MRO2 image
Below are two MRO2 images calculated from the same PET study,
where dynamic image was reconstructed with FBP and normal parameter settings.
In the latter case, dynamic image was further filtered
before calculation of K1 image using
imgdysmo with options -m=5 -s=4.
Images are not in the same colour scale.
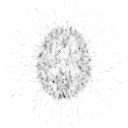
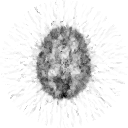
The level of results from parametric images should always be verified against results from regional curves. Noise in dynamic image may lead into biased results with distorted variance. Filtering of dynamic images may be needed to achieve the same quantitative results as in the regional analysis. To prevent artefacts and excessive loss of image resolution, the strength of filtering must not exceed the level that is required to achieve comparable results.
Potential problems
In brain PET studies with gaseous radiotracers the high radioactivity in face mask may cause severe image artefacts when conventional scatter correction methods are used, but appropriate selection of scatter correction method can solve the problem (Magota et al., 2017).
Caffeine may reduce CMRO2, via reduced cerebral perfusion that is only partially negated by increased OEF (Merola et al., 2017).
See also:
Literature
Baron J-C, Jones T. Oxygen metabolism, oxygen extraction and positron emission tomography: Historical perspective and impact on basic and clinical neuroscience. NeuroImage 2012; 61: 492-504. doi: 10.1016/j.neuroimage.2011.12.036.
Depresseux JC, Raichle ME, Larson KB, Markham J, Ter-Pogossian MM. An introduction to the measurement of the cerebral oxygen uptake rate by inhalation of 15O215O2> and H215O in brain radioactivity. Eur Neurol. 1981; 20(3): 207-214. doi: 10.1159/000115235.
Frackowiak RSJ, Lenzi G-L, Jones T, Heather J-D. Quantitative measurement of regional blood flow and oxygen metabolism in man using 15O and positron emission tomography: theory, procedure, and normal values. J Comput Assist Tomogr. 1980; 4(6): 727-736. PMID: 6971299.
Gjedde A, Ohta S, Kuwabara H, Meyer E. Is oxygen diffusion limiting blood-brain transfer of oxygen? In: Brain Work and mental Activity (Lassen NA, Ingvar DH, Raichle ME, Friberg L, eds.), Alfred Benzon Symposium 31, Copenhagen, 1991, pp 177-184.
Hattori N, Bergsneider M, Wu H-M, Glenn TC, Vespa PM, Hovda DA, Phelps ME, Huang S-C. Accuracy of a method using short inhalation of 15O-O2 for measuring cerebral oxygen extraction fraction with PET in healthy humans. J Nucl Med. 2004; 45(5): 765-770. PMID: 15136624.
Hayashi T, Watabe H, Kudomi N, Kim KM, Enmi J, Hayashida K, Iida H. A theoretical model of oxygen delivery and metabolism for physiologic interpretation of quantitative cerebral blood flow and metabolic rate of oxygen. J Cereb Blood Flow Metab. 2003; 23(11): 1314-1323. doi: 10.1097/01.WCB.0000090506.76664.00.
Herscovitch P. (1995): Cerebral blood flow, volume, and oxygen metabolism. In: Principles of Nuclear Medicine. (Eds. Wagner HN Jr, Szabo Z, Buchanan JW) 2nd ed., W.B. Saunders Co, Philadelphia, 505-514.
Holden JE, Eriksson L, Roland PE, Stone-Erlander S, Widen L, Kesselberg M. Direct comparison of single-scan autoradiographic with multiple-scan least squares fitting approaches to PET CMRO2 estimation. J Cereb Blood Flow Metab 1988; 8: 671-680. doi: 10.1038/jcbfm.1988.114.
Hori Y, Hirano Y, Koshino K, Moriguchi T, Iguchi S, Yamamoto A, Enmi J, Kawashima H, Zeniya T, Morita N, Nakagawara J, Casey ME, Iida H. Validity of using 3-dimensional PET scanner during inhalation of 15O-labeled oxygen for quantitative assessment of regional metabolic rate of oxygen in man. Phys Med Biol. 2014; 59: 5593-5609. doi: 10.1088/0031-9155/59/18/5593.
ICRP Publication 23, Reference Man: Anatomical, Physiological, and Metabolic Characteristics, International Commission on Radiological Protection, Pergamon Press, New York (1975).
Iida H, Iguchi S, Teramoto N, Koshino K, Zeniya T, Yamamoto A, Kudomi N, Moriguchi T, Hori Y, Enmi J, Kawashima H, Shah NJ, Nakagawara J. Adequacy of a compartment model for CMRO2 quantitation using 15O-labeled oxygen and PET: a clearance measurement of 15O-radioactivity following intracarotid bolus injection of 15O-labeled oxyhemoglobin on Macaca fascicularis. J Cereb Blood Flow Metab. 2014; 34: 1434-1439. doi: 10.1038/jcbfm.2014.118.
Ito H, Kanno I, iida H, Hatazawa J, Shimosegawa E, Tamura H, Okudera T. Arterial fraction of cerebral blood volume in humans measured by positron emission tomography. Ann Nucl Med 2001; 15: 111-116. PMID: 11448068.
Iwanishi K, Watabe H, Hayashi T, Miyake Y, Mianto K, Iida H. Influence of residual oxygen-15-labeled carbon monoxide radioactivity on cerebral blood flow and oxygen extraction fraction in a dual-tracer autoradiographic method. Ann Nucl Med. 2009; 23(4): 363-371. doi: 10.1007/s12149-009-0243-7.
Kudomi N, Hayashi T, Teramoto N, Watabe H, Kawachi N, Ohta Y, Kim KM, Iida H. Rapid quantitative measurement of CMRO2 and CBF by dual administration of 15O-labeled oxygen and water during a single PET scan - a validation study and error analysis in anesthetized monkeys. J Cereb Blood Flow Metab. 2005; 25: 1209-1224. doi: 10.1038/sj.jcbfm.9600118.
Kudomi N, Watabe H, Hayashi T, Iida H. Separation of input function for rapid measurement of quantitative CMRO2 and CBF in a signle PET scan with a dual tracer administration method. Phys Med Biol. 2007; 52: 1893-1908. doi: 10.1088/0031-9155/52/7/009.
Kudomi N, Hayashi T, Watabe H, Teramoto N, Piao R, Ose T, Koshino K, Ohta Y, Iida H. A physiologic model for recirculation water correction in CMRO2 assessment with 15O2 inhalation PET. J Cereb Blood Flow Metab. 2009; 29(2): 355-364. doi: 10.1038/jcbfm.2008.132.
Kudomi N, Hirano Y, Koshino K, Hayashi T, Watabe H, Fukushima K, Moriwaki H, Teramoto N, Iihara K, Iida H. Rapid quantitative CBF and CMRO2 measurements from a single PET scan withsequential administration of dual 15O-labeled tracers. J Cereb Blood Flow Metab. 2013; 33: 440-448. doi: 10.1038/jcbfm.2012.188.
Lammertsma AA, Heather JD, Jones T, Frackowiak RS, Lenzi GL. A statistical study of the steady state technique for measuring regional cerebral blood flow and oxygen utilization using 15O. J Comput Assist Tomogr. 1982; 6: 566–573. PMID: 6808033.
Lammertsma AA, Jones T. Correction for the presence of intravascular oxygen-15 in the steady-state technique for measuring regional oxygen extraction ratio in the brain: 1. Description of the method. J Cereb Blood Flow Metab. 1983; 3: 416–424. doi: 10.1038/jcbfm.1983.67.
Maeda Y, Kudomi N, Sasakawa Y, Monden T, Kato K, Yamamoto Y, Kawai N, Nishiyama Y. Applicability of emission-based attenuation map for rapid CBF, OEF, and CMRO2 measurements using gaseous 15O-labeled compounds. EJNMMI Phys. 2015; 2:12. doi: 10.1186/s40658-015-0115-2.
Mintun MA, Raichle ME, Martin WRW, Herscovitch P. Brain oxygen utilization measured with O-15 radiotracers and positron emission tomography. J Nucl Med 1984; 25; 177-187. PMID: 6610032.
Ohta S, Meyer E, Thompson CJ, Gjedde A. Oxygen consumption of the living human brain measured after a single inhalation of positron emitting oxygen. J Cereb Blood Flow Metab 1992; 12: 179-192. doi: 10.1038/jcbfm.1992.28.
Poulsen PH, Smith DF, Ostergaard L, Danielsen EH, Gee A, Hansen SB, Astrup J, Gjedde A. In vivo estimation of cerebral blood flow, oxygen consumption and glucose metabolism in the pig by [15O]water injection, [15O]oxygen inhalation and dual injections of [18F]fluorodeoxyglucose. J Neurosci Methods 1997; 77:199-209. doi: 10.1016/S0165-0270(97)00127-1.
Sasakawa Y, Kudomi N, Yamamoto Y, Monden T, Kawai N, Nishiyama Y. Omission of [15O]CO scan for PET CMRO2 examination using 15O-labelled compounds. Ann Nucl Med. 2011; 25: 189-196. doi: 10.1007/s12149-010-0438-y.
Shidahara M, Watabe H, Kim KM, Kudomi N, Ito H, Iida H. Optimal scan time of oxygen-15-labeled gas inhalation autoradiographic method for measurement of cerebral oxygen extraction fraction and cerebral oxygen metabolic rate. Ann Nucl Med. 2008; 22: 667-675. doi: 10.1007/s12149-008-0157-9.
Temma T, Koshino K, Moriguchi T, Enmi J, Iida H. PET quantification of cerebral oxygen metabolism in small animals. ScientificWorldJournal 2014; 159103. doi: 10.1155/2014/159103.
Ter-Pogossian MM, Eichling JO, Davis DO, Welch MJ. The measure in vivo of regional cerebral oxygen utilization by means of oxyhemoglobin labeled with radioactive oxygen-15. J Clin Invest. 1970; 49: 381–391. doi: 10.1172/JCI106247.
Ter-Pogossian MM, Herscovitch P. Radioactive oxygen-15 in the study of cerebral blood flow, blood volume, and oxygen metabolism. Semin Nucl Med. 1985; XV(4): 377-394. doi: 10.1016/S0001-2998(85)80015-5.
Updated at: 2023-10-19
Created at: 2007-09-18
Written by: Vesa Oikonen