Quantification of [11C]PBR28 PET studies

PBR28 is a selective second-generation ligand with high affinity for the translocator protein (TSPO), formerly known as peripheral benzodiazepine receptor (PBR), a marker of mitochondria and inflammation. Increased distribution volume of [11C]PBR28 has been observed in the brain of baboons and humans after injection of E. Coli lipopolysaccharide (Hannestad et al., 2012; Sandiego et al, 2015; Yoder et al, 2015). The cerebral artery occlusion model of neuroinflammation and stroke in rats has shown a localized increase in [11C]PBR28 SUV (Imaizumi et al, 2007; Tóth et al, 2016), and that increase could be reversed by injection of PK11195 (Imaizumi et al, 2007). Also herpes simplex encephalitis model in rats resulted into increased [11C]PBR28 uptake (Parente et al, 2016). Alzheimer's disease model in mice has shown increased [11C]PBR28 uptake (Mirzaei et al, 2016). Shao et al (2013) demonstrated increased [11C]PBR28 SUV in rat models of acute inflammation (induced with carrageenan) and adjuvant arthritis model. [11C]PBR28 SUV is increased in the synovium of rheumatoid arthritis patients (Narayan et al., 2018). [11C]PBR28 SUV increased in the aged rats with increasing neuroinflammation (Walker et al, 2015).
In humans, genetic polymorphism (rs6971) affects the binding of [11C]PBR28 and other TSPO ligands, leading to three TSPO binding profiles: high-affinity binders (HAB), low-affinity binders (LAB) with 50-fold reduction in affinity, and mixed-affinity binders (MAB) which express both TSPO types in equal proportion (Owen et al, 2011 and 2012; Kreisl et al., 2010 and 2013a; Yoder et al, 2013). [11C]PBR28 uptake in LAB group is too low to be reliably quantified with PET; therefore genotyping must be done prior to PET to omit the LAB subjects. The rs6971 polymorphism affects cholesterol binding to TSPO, and in MAB group [11C]PBR28 uptake has been shown to correlate negatively with plasma cholesterol level (Kim et al., 2018).
Increased uptake of [11C]PBR28 has been seen in MS patients (Oh et al, 2011; Park et al, 2015), in ALS (Zürcher et al, 2015), and in HIV-positive humans (Vera et al, 2016). [11C]PBR28 binding correlates with severity of Alzheimer's disease (Kreisl et al, 2013b). Myeloperoxidase inhibition in patients with Parkinson's disease decreased the binding of [11C]PBR28 (Jucaite et al., 2015). TSPO blocking study in rhesus monkeys suggests that non-displaceable uptake is very small, only about 5% of the total distribution volume (Imaizumi et al., 2008). In human TSPO blocking study VND was estimated to be about 2, while VT was about 3 and 4 for MAB and HAB groups, respectively, suggesting that BPND in HAB is twice that of MABs (Owen et al, 2014).
The highest uptake of [11C]PBR28 is in kidneys, spleen, heart, and lungs, organs with high TSPO expression, except in LAB where uptake can only be seen in the liver, gallbladder, and urinary bladder (Brown et al, 2007; Kreisl et al, 2010).
Brain
Scan protocol
90-minute dynamic scan with arterial blood sampling is typically used (Kreisl et al, 2013b; Owen et al, 2014; Rizzo et al, 2014; Gershen et al, 2015; Bloomfield et al, 2016; Collste et al., 2016). Hirvonen et al (2012), Hannestad et al (2013), Park et al (2015), and Sandiego et al (2015) scanned subjects for 120 minutes. Jucaite et al (2015) performed the analysis using 45-, 60-, and 90-min time intervals, and recommended using 60-min scans to minimize contribution of radioligand metabolites to the brain data.
Scans should be performed at the same time of day, because afternoon scans tend to provide higher uptake values than morning scans because of changes in plasma concentrations (Collste et al., 2016).
Propofol anaesthesia may markedly decrease distribution volume of [11C]PBR28 in the human brain (Hines et al., 2013).
Analysis methods
TSPO is expressed not only on activated microglia but also in endothelial walls and immune cells of the blood. The marked endothelial binding of [11C]PBR28 and other second-generation TSPO ligands prevents the use of traditional reference tissue models or using supervised cluster analysis to extract the reference time-activity curve, since there is no TSPO-free region (Imaizumi et al., 2008).
Quantification of [11C]PBR28 brain PET studies is usually performed using reversible two-tissue compartmental model (2TCM) (Fujita et al., 2008). Compartmental models with arterial plasma input provide us the distribution volume (VT). VT estimated using multilinear analysis MA1 with fit start time of 30 min was found to correlate well with VT from 2TCM by Hannestad et al (2013) and Park et al (2015). Sandiego et al (2015) used LEGA method (start time 30 min) to calculate parametric VT images. In contrast to several human studies, in rhesus monkeys the 1TCM was found to provide more accurate VT than 2TCM (Imaizumi et al., 2008).
TSPO tracer kinetics in the brain seem to consist of a slow irreversible (during PET scan) component localized in the brain main vasculature, venous sinuses, and arteries, as well as a faster reversible component attributed to microglia (Rizzo et al, 2014). When the slow component for endothelial vascular TSPO binding has been included in the compartmental model (2TCM-1K), substantially better fits have been obtained. Resulting VT estimates are about one-third of the VTs from conventional 2TCM analysis, and correlation is poor (Rizzo et al., 2014). Simulations suggest that 2TCM-1K would provide VT that is more sensitive to true variations in microglial TSPO binding. In addition to endothelial vascular binding, 2TCM-1K might also correct for tissue uptake of label-carrying plasma metabolites of the radioligand. 2TCM-1K model has since been used by Bloomfield et al (2016).
Oh et al (2011) used Logan plot to calculate parametric VT images from 120-min PET scans; image noise leads to negative bias in Logan plot VT, and VT in image was indeed 9% smaller than VT from regional analysis. Noise-induced bias in VT images can be reduced by using stationary wavelet aided parametric imaging (WAPI) approach (Jucaite et al., 2015; Collste et al., 2016; Forsberg et al., 2017). Albrecht et al (2019) fitted Logan plot using data range of 33-63 min. In rats, both Logan plot and 2TCM are feasible (Tóth et al, 2015).
In addition to Logan plot, spectral analysis is another modelling approach which does not assume any specific compartmental model. It can be used to produce high-quality VT images (Veronese et al., 2021).
VT in HAB group is about 40% higher than in MAB group (Kreisl et al, 2013a). Therefore Gershen et al (2015) multiplied the VT in MAB group by 1.4.
VT shows high intersubject variability, also after taking TSPO genotype into account. The mean absolute variability in VT (estimated using 2TCM where VB was fixed to 5%) in the brain gray matter in healthy human subjects, determined in test-retest setting, was 18.3±12.7 % and ICC 0.90-0.94 for 91-min scans (Collste et al., 2016); reducing analysis time to 63 min did not increase the variability. Performing both of the scans at the same time of the day reduced variance to 15.9±12.2 % for the 91-min analysis, since the afternoon scans resulted in higher VT estimates than morning scans; this was caused by reduced plasma TAC in the afternoon scans (Collste et al., 2016). Age, BMI, and sex can be confounding factors in clinical studies (Tuisku et al., 2019).
Alterations in cerebral perfusion do not influence the outcome measures of [11C]PBR28 PET, not even late-scan SUV (Sander et al., 2021).
One possible cause for the high intersubject variability of VT may be the variable plasma protein binding of the tracer (Rizzo et al, 2014; Bloomfield et al, 2016). Therefore VT has been divided by the measured free fraction of tracer in the plasma (fp) (Oh et al. 2011; Hannestad et al, 2013; Gershen et al, 2015; Lyoo et al, 2015; Richards et al., 2018). However it has been estimated that the measurement error and noise from fp may even increase the variability in "corrected" VT (Park et al, 2015; Bloomfield et al, 2016), and therefore it has been proposed that VT ratio should be used instead, obtained by dividing regional VT by VT from the whole brain (Bloomfield et al, 2016). Lyoo et al (2015) did not find any difference in COV% of VT and VT/fp. Kanegawa et al (2016) have shown that [11C]PBR28 binding in blood cells correlates with VT in the brain, even when TSPO genotype is taken into account. Normalization of brain VT by VT of blood cells reduced intra-individual variability only when time between PET scans was short (Kanegawa et al., 2016).
Another cause for intersubject variability of VT may be variable nondisplaceable binding (VND) in the brain, as VT is the sum of ligand-specific distribution volume (VS) and (VND). When VND was estimated using SIME, group differences were found, with lower VND in subjects with PD and alcohol-use disorder (Laurell et al., 2021). In patients with schizophrenia diagnosis VND is similar (∼2) to healthy subjects (Marques et al., 2021). In SIME application the K1/k2 was constrained to be the same across a set of brain regions (Schain et al., 2018; Plavén-Sigray et al., 2019).
In TSPO occupancy studies, Lassen plot, or occupancy plot, can be applied to 2TCM derived VT values to estimate VND (Frankle et al., 2017; Marques et al., 2021).
Logan plot with reference tissue input has also been used to analyse [11C]PBR28 data. Datta et al (2017) used caudate as the reference region when studying brain white matter in healthy subjects and subjects with MS.
SUV and SUVR
Standardized uptake value (SUV) is a semiquantitative method that is often used to analyse also [11C]PBR28 data. Tóth et al (2015) have shown that SUV and VT correlate well in healthy rats and mice, and test-retest variability is good. However, in baboon studies correlation was poor (Yoder et al, 2015).
In human studies, SUV calculation time was set to 40-90 min by Kim et al (2013) and Gershen et al (2015), 60-90 min by Zürcher et al (2015), 60-120 min by Hirvonen et al (2012), and 33-63 min by Albrecht et al (2019). Lyoo et al (2015) noticed that uptake in cerebellum did not differ between healthy subjects and patients with Alzheimer's disease (AD), and proposed using SUV ratio (SUVR) from 60-90 min, with cerebellum as pseudo-reference region. Nair et al (2016) reported that the best test-retest variability in AD study was obtained when using whole brain as the pseudo-reference. Whole brain (not including the ventricles) has been used as reference to calculate SUVR maps from data range 60-90 min in several brain studies (Loggia et al., 2015; Zürcher et al., 2015; Albrecht et al., 2021). Albrecht et al (2018) proposed using occipital cortex as pseudo-reference region in patients with chronic low back pain or ALS, and used it also in PET studies of fibromyalgia patients (Albrecht et al., 2019).
If inflammation is localized on one side of the brain only, for example in stroke or epilepsy, Asymmetry index (AI) can be calculated from SUV (Gershen et al., 2015). In studies of lumbar radiculopathy, the two sides of neurofamina (containing dorsal root ganglion and nerve roots) can be compared, and for the spinal cord, healthy spinal cord segments can be used as reference (Albrecht et al., 2018).
In a mice study SUV between 30 and 60 min was calculated, and normalized by dividing it with the SUV of heart (Mirzaei et al., 2016).
Brown adipose tissue
Because of the abundance of mitochondria in brown adipose tissue (BAT), TSPO tracers have the potential to be used for in vivo detection of BAT. Ran et al. (2018) have successfully used [11C]PBR28 PET late scan (60-90 min p.i.) in BAT imaging in humans.
Arterial plasma input
The binding group affects the arterial plasma input curves (examples in Fig 1). Reliable image-derived arterial input function is difficult to obtain (Zanotti-Fregonara et al., 2011), and thus arterial sampling is recommended.
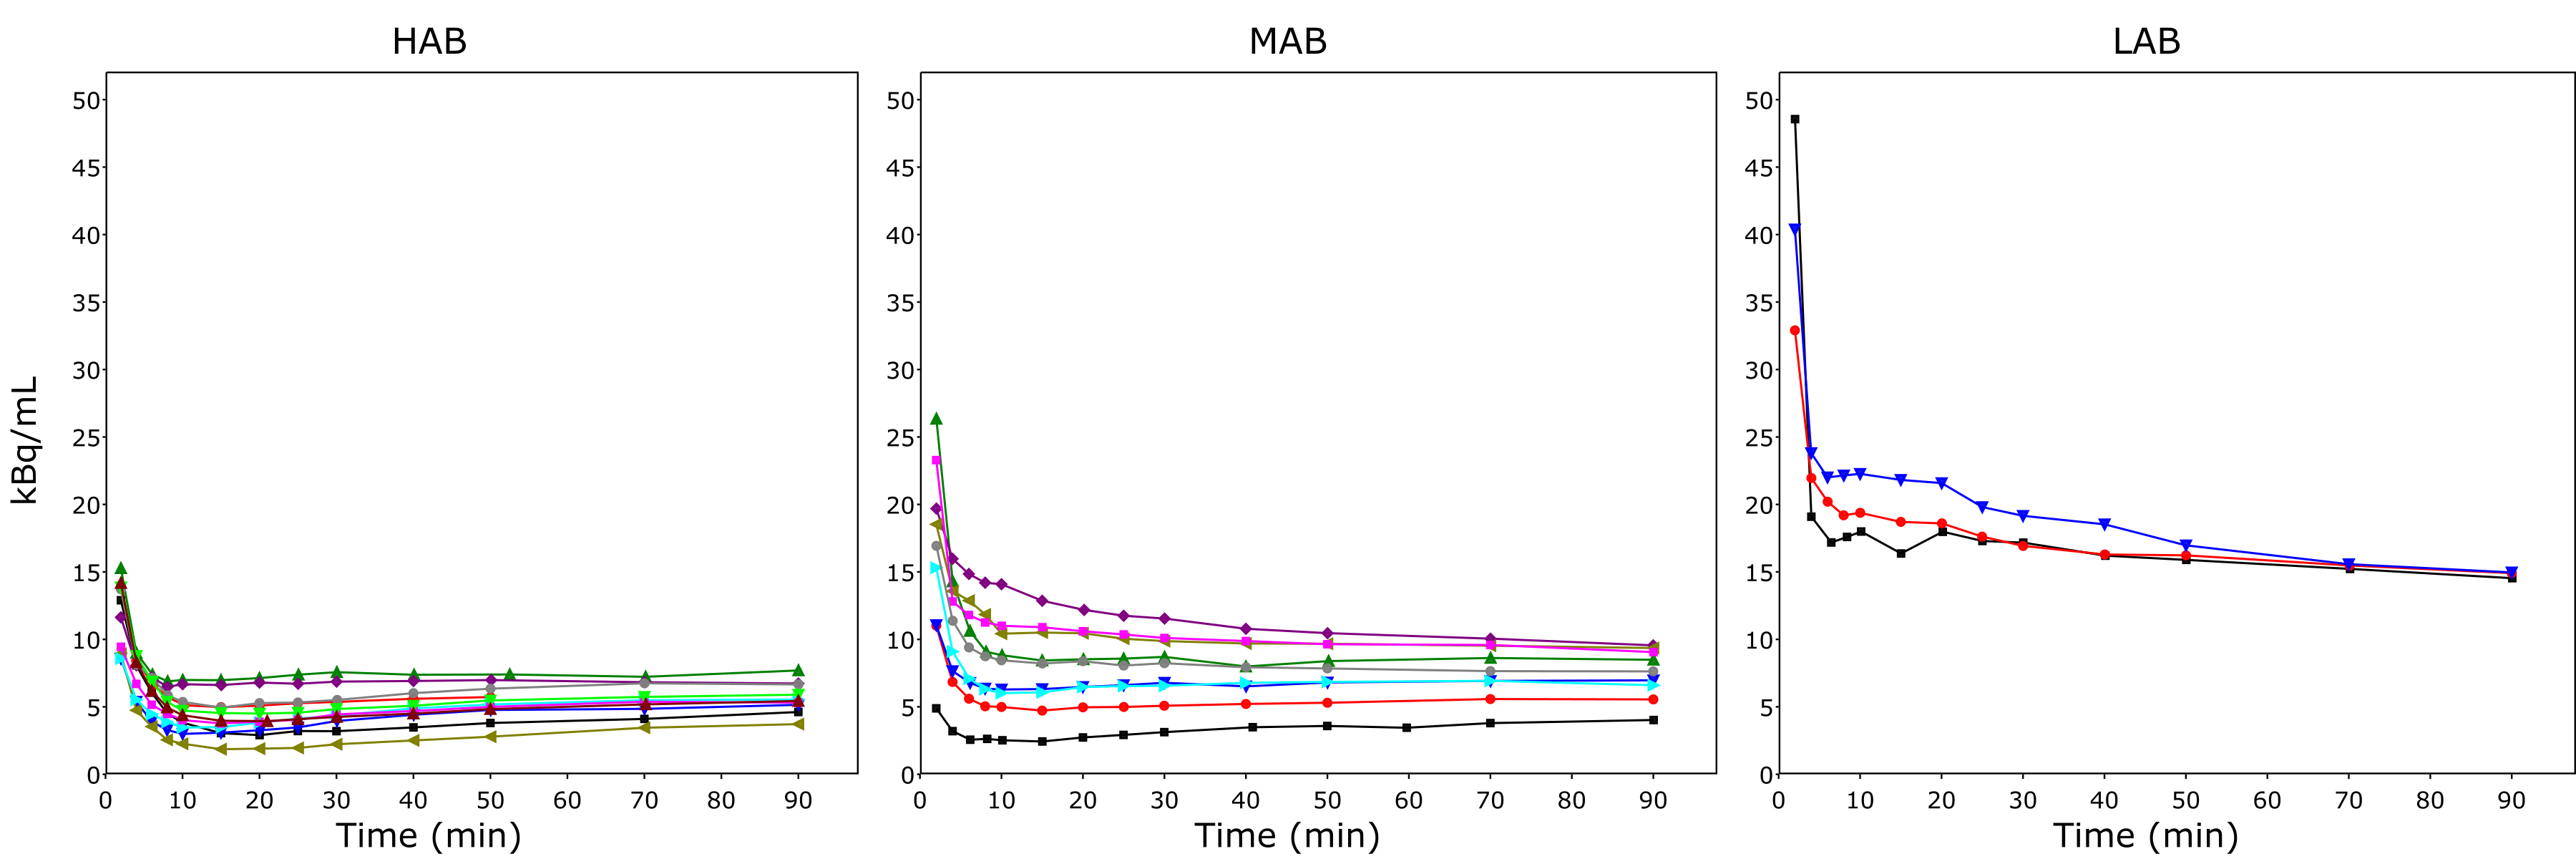
The plasma curves are on highest levels in LAB subjects (Fig 1) because the specific binding to TSPO in all organs is low and therefore [11C]PBR28 stays longer in the circulation. In the subjects of the HAB group the clearance of [11C]PBR28 is so fast that the total plasma radioactivity concentration is soon dominated by label-carrying metabolites, which have relatively low clearance, causing the total plasma curve to increase after ∼20 min. This can be seen even in some subjects of the MAB group.
Blood-to-plasma conversion
Correction of arterial blood TAC to plasma requires
that plasma-to-blood ratio is known. This ratio for [11C]PBR28 is changing during
the scan, and it is different in the binding groups.
Blood-to-plasma ratios can be fitted using
program fit_bpr,
with option -model=ihillb for HAB and MAB groups, and option -model=hillb
for LAB group.
Population ratio curves for each binding group are implemented in programs b2plasma and p2blood.
Plasma metabolite correction
Arterial plasma TAC needs to be corrected for metabolites. Nakao et al (2013) have published method for assessing plasma protein binding and metabolites simultaneously in a [11C]PBR28 study.
Collste et al (2016) fitted plasma parent fractions with three-exponential function, and Albrecht et al (2018) with biexponential function. Parente et al (2016) used one-phase exponential function in rat studies. Narendran et al (2014) applied the Hill model fitting:
This Hill function has also been used in Turku.
Bloomfield et al (2016) and Marques et al (2021) used extended Hill (sigmoidal) function for fitting [11C]PBR28 plasma parent fractions:
, where p1 > 0.
Owen et al (2014) fitted parent fractions using sigmoid function:
Park et al (2015) fitted plasma parent fractions with an inverted gamma function.
Metabolite corrected plasma TAC can be further fitted to sum of three exponentials from the time of peak (Narendran et al., 2014).
See also:
- PET imaging of the translocator protein (TSPO)
- Inflammation imaging
- [11C]-R-PK11195
- [18F]DPA-714
- Processing input data
- Population-based input function
Literature
Bloomfield PS, Selvaraj S, Veronese M, Rizzo G, Bertoldo A, Owen DR, Bloomfield MA, Bonoldi I, Kalk N, Turkheimer F, McGuire P, de Paola V, Howes OD. Microglial activity in people at ultra high risk of psychosis and in schizophrenia: An [11C]PBR28 PET brain imaging study. Am J Psychiatry 2016; 173(1): 44-52. doi: 10.1176/appi.ajp.2015.14101358.
Collste K, Forsberg A, Varrone A, Amini N, Aeinehband S, Yakushev I, Halldin C, Farde L, Cervenka S. Test-retest reproducibility of [11C]PBR28 binding to TSPO in healthy control subjects. Eur J Nucl Med Mol Imaging 2016; 43(1): 173-183. doi: 10.1007/s00259-015-3149-8.
Fujita M, Imaizumi M, Zoghbi SS, Fujimura Y, Farris AG, Suhara T, Hong J, Pike VW, Innis RB. Kinetic analysis in healthy humans of a novel positron emission tomography radioligand to image the peripheral benzodiazepine receptor, a potential biomarker for inflammation. Neuroimage 2008; 40(1): 43-52. doi: 10.1016/j.neuroimage.2007.11.011.
Gershen LD, Zanotti-Fregonara P, Dustin IH, Liow JS, Hirvonen J, Kreisl WC, Jenko KJ, Inati SK, Fujita M, Morse CL, Brouwer C, Hong JS, Pike VW, Zoghbi SS, Innis RB, Theodore WH. Neuroinflammation in temporal lobe epilepsy measured using positron emission tomographic imaging of translocator protein. JAMA Neurol. 2015; 72(8): 882-888. doi: 10.1001/jamaneurol.2015.0941.
Hines CS, Fujita M, Zoghbi SS, Kim JS, Quezado Z, Herscovitch P, Miao N, Ferraris Araneta MD, Morse C, Pike VW, Labovsky J, Innis RB. Propofol decreases in vivo binding of 11C-PBR28 to translocator protein (18 kDa) in the human brain. J Nucl Med. 2013; 54(1): 64-69. doi: 10.2967/jnumed.112.106872.
Imaizumi M, Briard E, Zoghbi SS, Gourley JP, Hong J, Fujimura Y, Pike VW, Innis RB, Fujita M. Brain and whole-body imaging in nonhuman primates of [11C]PBR28, a promising PET radioligand for peripheral benzodiazepine receptors. Neuroimage 2008; 39(3): 1289-1298. doi: 10.1016/j.neuroimage.2007.09.063.
Kreisl WC, Fujita M, Fujimura Y, Kimura N, Jenko KJ, Kannan P, Hong J, Morse CL, Zoghbi SS, Gladding RL, Jacobson S, Oh U, Pike VW, Innis RB. Comparison of [11C]-(R)-PK 11195 and [11C]PBR28, two radioligands for translocator protein (18 kDa) in human and monkey: Implications for positron emission tomographic imaging of this inflammation biomarker. Neuroimage 2010; 49(4): 2924-2932. doi: 10.1016/j.neuroimage.2009.11.056
Kreisl WC, Jenko KJ, Hines CS, Lyoo CH, Corona W, Morse CL, Zoghbi SS, Hyde T, Kleinman JE, Pike VW, McMahon FJ, Innis RB. A genetic polymorphism for translocator protein 18 kDa affects both in vitro and in vivo radioligand binding in human brain to this putative biomarker of neuroinflammation. J Cereb Blood Flow Metab. 2013a; 33(1): 53-58. doi: 10.1038/jcbfm.2012.131.
Kreisl WC, Lyoo CH, McGwier M, Snow J, Jenko KJ, Kimura N, Corona W, Morse CL, Zoghbi SS, Pike VW, McMahon FJ, Turner RS, Innis RB. In vivo radioligand binding to translocator protein correlates with severity of Alzheimer's disease. Brain 2013b; 136(Pt 7): 2228-2238. doi: 10.1093/brain/awt145.
Lyoo CH, Ikawa M, Liow JS, Zoghbi SS, Morse CL, Pike VW, Fujita M, Innis RB, Kreisl WC. Cerebellum can serve as a pseudo-reference region in Alzheimer disease to detect neuroinflammation measured with PET radioligand binding to translocator protein. J Nucl Med. 2015; 56(5): 701-706. doi: 10.2967/jnumed.114.146027.
Owen DR, Gunn RN, Rabiner EA, Bennacef I, Fujita M, Kreisl WC, Innis RB, Pike VW, Reynolds R, Matthews PM, Parker CA. Mixed-affinity binding in humans with 18-kDa translocator protein ligands. J Nucl Med. 2011; 52(1): 24-32. doi: 10.2967/jnumed.110.079459.
Owen DR, Yeo AJ, Gunn RN, Song K, Wadsworth G, Lewis A, Rhodes C, Pulford DJ, Bennacef I, Parker CA, StJean PL, Cardon LR, Mooser VE, Matthews PM, Rabiner EA, Rubio JP. An 18-kDa translocator protein (TSPO) polymorphism explains differences in binding affinity of the PET radioligand PBR28. J Cereb Blood Flow Metab. 2012; 32(1): 1-5. doi: 10.1038/jcbfm.2011.147.
Owen DR, Guo Q, Kalk NJ, Colasanti A, Kalogiannopoulou D, Dimber R, Lewis YL, Libri V, Barletta J, Ramada-Magalhaes J, Kamalakaran A, Nutt DJ, Passchier J, Matthews PM, Gunn RN, Rabiner EA. Determination of [11C]PBR28 binding potential in vivo: a first human TSPO blocking study. J Cereb Blood Flow Metab. 2014; 34(6): 989-994. doi: 10.1038/jcbfm.2014.46.
Park E, Gallezot JD, Delgadillo A, Liu S, Planeta B, Lin SF, O'Connor KC, Lim K, Lee JY, Chastre A, Chen MK, Seneca N, Leppert D, Huang Y, Carson RE, Pelletier D. 11C-PBR28 imaging in multiple sclerosis patients and healthy controls: test-retest reproducibility and focal visualization of active white matter areas. Eur J Nucl Med Mol Imaging 2015; 42(7): 1081-1092. doi: 10.1007/s00259-015-3043-4.
Rizzo G, Veronese M, Tonietto M, Zanotti-Fregonara P, Turkheimer FE, Bertoldo A. Kinetic modeling without accounting for the vascular component impairs the quantification of [11C]PBR28 brain PET data. J Cereb Blood Flow Metab. 2014; 34(6): 1060-1069. doi: 10.1038/jcbfm.2014.55.
Tóth M, Doorduin J, Häggkvist J, Varrone A, Amini N, Halldin C, Gulyás B. Positron emission tomography studies with [11C]PBR28 in the healthy rodent brain: Validating SUV as an outcome measure of neuroinflammation. PLoS One 2015; 10(5):e0125917. doi: 10.1371/journal.pone.0125917.
Yoder KK, Nho K, Risacher SL, Kim S, Shen L, Saykin AJ. Influence of TSPO genotype on 11C-PBR28 standardized uptake values. J Nucl Med. 2013; 54(8): 1320-1322. doi: 10.2967/jnumed.112.118885.
Yoder KK, Territo PR, Hutchins GD, Hannestad J, Morris ED, Gallezot JD, Normandin MD, Cosgrove KP. Comparison of standardized uptake values with volume of distribution for quantitation of [11C]PBR28 brain uptake. Nucl Med Biol. 2015; 42(3): 305-308. doi: 10.1016/j.nucmedbio.2014.11.003.
Tags: Inflammation, TSPO, Glial cells
Updated at: 2022-01-16
Created at: 2015-08-03
Written by: Vesa Oikonen, Jouni Tuisku